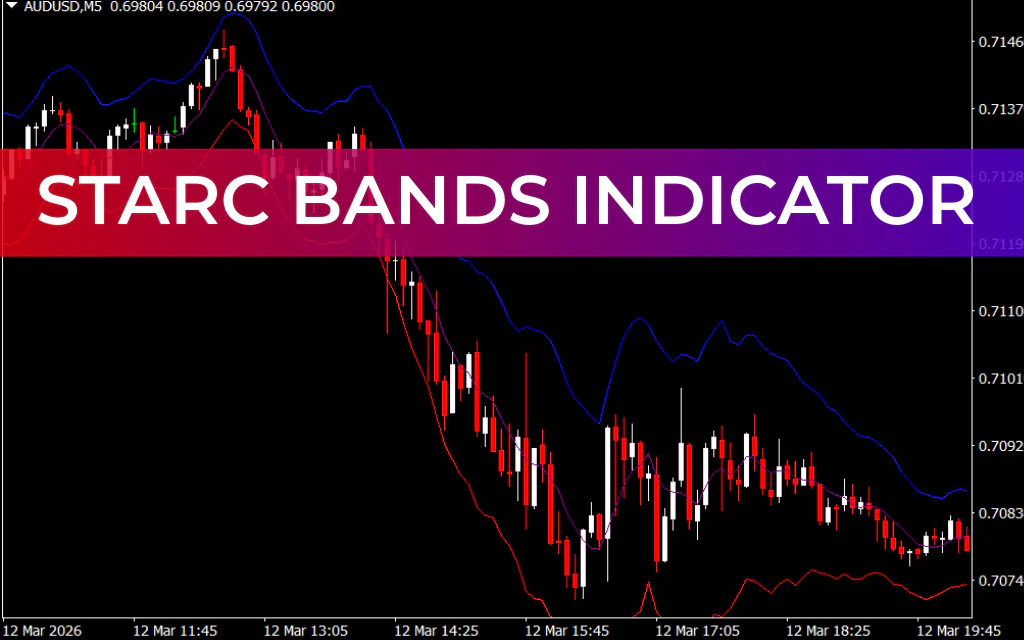
The Starc Bands Indicator for MT4 (Stoller Average Range Channels) is a powerful technical analysis tool used by forex traders to identify potential trend reversals and optimal trade entries. This indicator works by enclosing price within dynamic bands, helping traders detect when the market may be overbought or oversold.
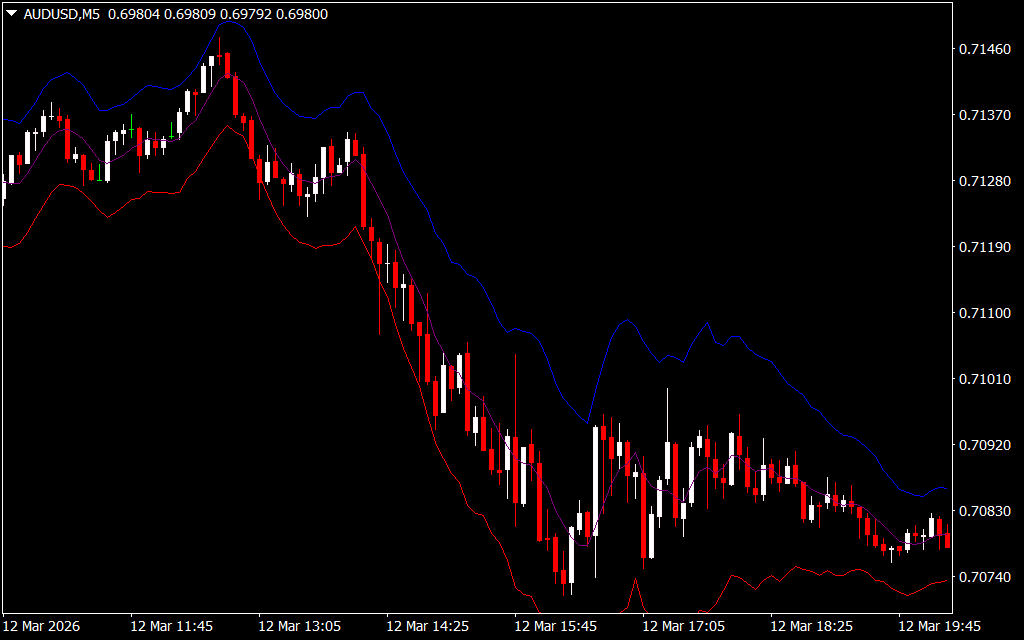
Similar in appearance to Bollinger Bands, the Starc Bands indicator provides clear boundaries that highlight areas where price may reverse. It is designed to run on the **MetaTrader 4 trading platform and is suitable for traders of all experience levels.
What Are Starc Bands?
The Starc Bands indicator consists of three main bands plotted on the chart:
- Upper Band
- Middle Band
- Lower Band
The middle band is a Simple Moving Average (SMA) that represents the overall direction of the market trend.
The upper and lower bands are calculated by combining the SMA with the Average True Range (ATR). This creates dynamic channels that expand and contract based on market volatility.
Band Calculation
- Upper Band: SMA + ATR
- Lower Band: SMA − ATR
Because the bands incorporate ATR, they automatically adjust to market volatility, expanding during volatile periods and contracting when the market becomes calm.
Key Features of the Starc Bands Indicator
The Starc Bands indicator provides traders with important price boundary information that can help identify high-probability trading opportunities.
Main Features
- Automatically detects overbought and oversold zones
- Uses SMA and ATR for dynamic price channels
- Helps identify trend direction and reversals
- Adapts to market volatility
- Suitable for Scalping, day trading, and swing trading
- Easy to use for beginner and advanced traders
Because the indicator performs the analysis in the background, traders can quickly interpret price movements directly from the chart.
How the Starc Bands Indicator Works
The Starc Bands indicator sets price boundaries using the upper and lower bands.
These bands act as extreme levels where price is more likely to reverse.
- Upper Band: Indicates a potential overbought region
- Lower Band: Indicates a potential oversold region
The middle band acts as a trend guide:
- Price above the middle band: Bullish trend
- Price below the middle band: Bearish trend
As market volatility changes, the bands expand and contract, providing traders with a clearer view of potential price limits.
Starc Bands BUY Setup
To identify a potential buy opportunity, follow these steps:
- Wait for price to touch the lower band.
- Look for strong rejection signals, such as a long lower wick.
- Confirm the setup when the next candle closes bullish.
- Enter a BUY/LONG position after confirmation.
Double wick rejections near the lower band often indicate strong buying pressure, increasing the probability of a price reversal.
Starc Bands SELL Setup
For a potential sell trade, follow this approach:
- Wait for price to reach the upper band.
- Look for clear rejection, such as a long upper wick.
- Confirm the setup when the next candle closes bearish.
- Enter a SELL/SHORT position once confirmation appears.
This setup suggests that the market may be overbought and ready for a downward correction.
Best Timeframes for Using Starc Bands
Although the indicator works on any timeframe in MetaTrader 4, many traders find it most reliable on higher timeframes, where signals tend to be stronger and less affected by market noise.
Common trading styles that use this indicator include:
- Scalping
- Day trading
- Swing trading
Why Traders Use the Starc Bands Indicator
Forex traders value this indicator because it clearly defines price limits and potential reversal zones.
Benefits include:
- Clear overbought and oversold levels
- Dynamic channels based on market volatility
- Useful for entry and exit timing
- Works well with Price Action strategies
- Suitable for traders of all experience levels
Conclusion
The Starc Bands Indicator for MT4 is a powerful trading tool that helps traders identify high-probability reversal zones and understand price boundaries in the forex market.
By combining Simple Moving Average (SMA) with Average True Range (ATR), the indicator adapts to market volatility and provides valuable insights for timing trades.
When used with proper confirmation signals and risk management, the Starc Bands indicator can significantly improve trading accuracy and decision-making.
FAQ
Published:
Mar 15, 2026 18:38 PM
Category: