The DMX Jurik Histogram Indicator for MT4 is a simple yet effective trend-following tool designed for the MetaTrader 4 platform. This indicator combines moving average calculations and histogram analysis to determine the direction of the market trend and highlight potential trading opportunities.
It works similarly to the classic Directional Movement Index (DMI) and uses directional movement calculations to identify bullish and bearish market conditions. The indicator analyzes price highs and lows to generate two directional movement lines:
- +DI (Positive Directional Movement) – Indicates bullish momentum
- −DI (Negative Directional Movement) – Indicates bearish momentum
In addition, traders can use the Average Directional Index (ADX) to measure the strength of the trend.
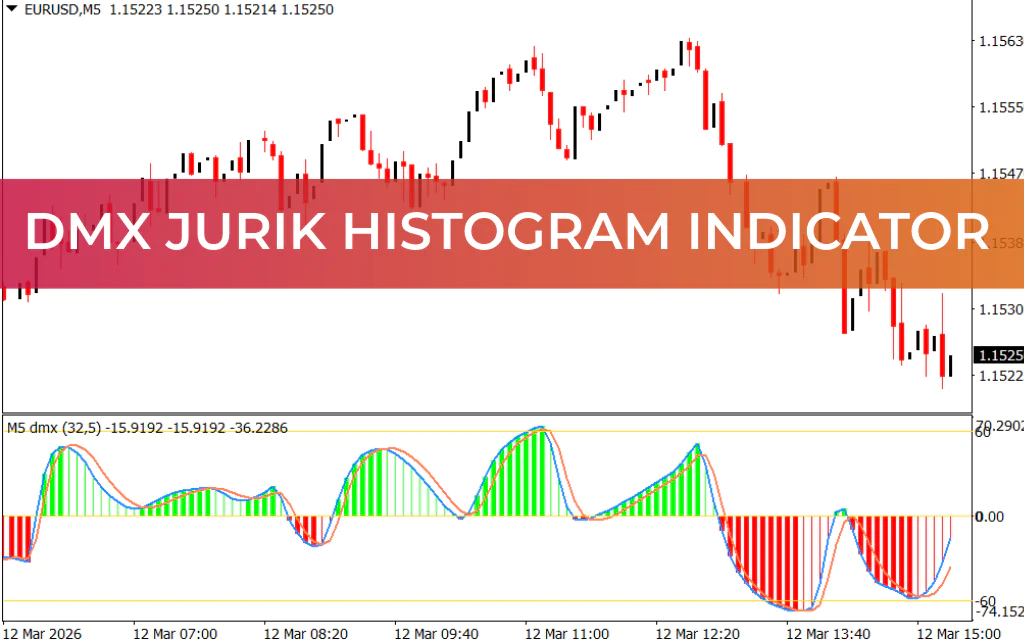
How the DMX Jurik Histogram Indicator Works
The indicator displays a histogram in a separate window below the main price chart.
The histogram uses color-coded bars to show market direction:
- Green Bars – Bullish trend
- Red Bars – Bearish trend
This visual representation allows traders to quickly identify the prevailing market trend without analyzing multiple lines on the chart.
The indicator oscillates between -60 and +60, which represent key momentum levels.
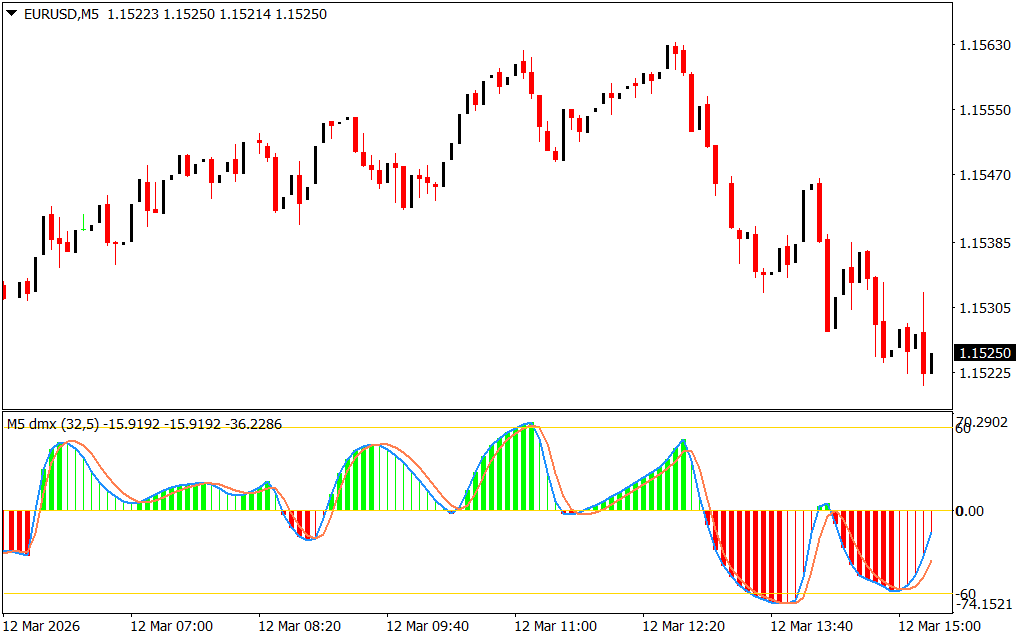
Overbought and Oversold Levels
The DMX Jurik Histogram also helps traders identify potential overbought and oversold conditions.
- Below -60 – Oversold zone, suggesting potential buying opportunities.
- Above +60 – Overbought zone, indicating possible selling pressure.
These levels can help traders anticipate trend reversals or momentum shifts.
Buy Signal
A buy signal occurs when:
- The histogram shows green bars.
- The indicator moves above the +60 level.
This setup indicates strong bullish momentum, suggesting traders may consider entering long positions.
Sell Signal
A sell signal occurs when:
- The histogram displays red bars.
- The indicator drops below the -60 level.
This condition signals strong bearish momentum, providing a potential opportunity to enter short trades.
Using the Indicator for Trade Exits
Traders can also use the DMX Jurik Histogram to manage open positions.
A common exit strategy includes:
- Closing buy trades when the histogram changes from green to red.
- Closing sell trades when the histogram shifts from red to green.
This color change often indicates a possible shift in market momentum.
Advantages of the DMX Jurik Histogram Indicator
The indicator offers several key benefits:
- Simple color-based trend signals
- Identifies overbought and oversold conditions
- Helps detect trend reversals
- Works across multiple timeframes
- Easy to combine with other technical indicators
Many traders combine it with Support And Resistance levels, price action, or momentum indicators to improve accuracy.
Conclusion
The DMX Jurik Histogram Indicator for MT4 is a reliable trend analysis tool that helps traders identify bullish and bearish market conditions through a clear histogram display. By highlighting overbought and oversold levels while showing trend direction, it simplifies technical analysis for both beginner and experienced traders.
With its straightforward signals and compatibility with multiple trading strategies, the indicator can become a valuable addition to any trader’s MetaTrader 4 toolkit.
FAQ
Published:
Mar 12, 2026 10:24 AM
Category: