TDI RT Indicator for MT4 – Real-Time Trend and Signal Detection
The TDI RT Indicator (Trader’s Dynamic Index – Real-Time) for MT4 is a powerful trading tool that combines RSI, Moving Average, and Bollinger Bands to provide accurate BUY and SELL signals. With a long history of use in the forex market, this indicator effectively identifies BULLISH and BEARISH trends, making it suitable for both beginner and advanced traders.
The TDI RT Indicator works across all intraday charts as well as daily, weekly, and monthly timeframes, offering versatility for multiple trading strategies. It is free to download and easy to install.
How the TDI RT Indicator Works
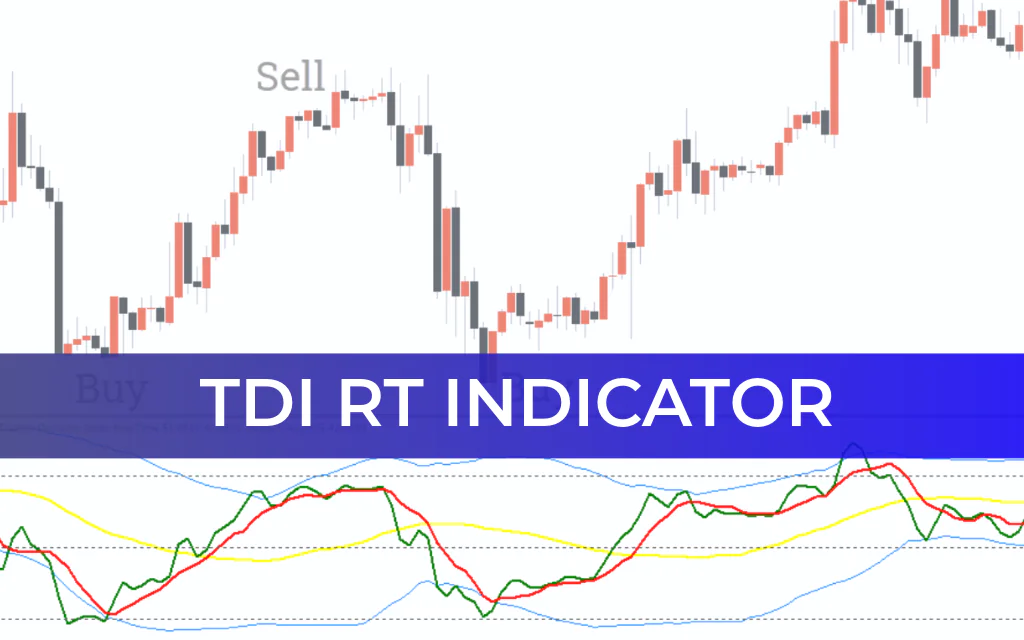
The indicator uses multiple lines and bands to provide trading insights:
RSI Line (GREEN) – Measures price momentum
Moving Average Signal Line (RED) – Confirms trend direction
Bollinger Bands (BLUE) – Indicates overbought and oversold levels
Market Baseline (YELLOW) – Shows overall market trend
Trading Signals:
BUY Signal: When the GREEN RSI line crosses above the RED Moving Average line near the lower Bollinger band, with confirmation that the YELLOW Market Baseline is upward.
SELL Signal: When the GREEN RSI line crosses below the RED Moving Average line near the upper Bollinger band, with confirmation that the YELLOW Market Baseline is downward.
Divergence: Divergence between price and the TDI lines signals potential price exhaustion, suggesting an exit from existing trades.
TDI Angle: A steeper angle between the GREEN and RED lines indicates a stronger trend; flatter angles suggest caution.
Additional Tips for Traders
Combine the TDI RT indicator with trendlines, channels, and support/resistance levels to validate trading signals.
Use multi-timeframe analysis for more accurate entries and exits.
Best results occur when TDI signals are combined with Price Action analysis.
Conclusion
The TDI RT Indicator for MT4 is a reliable, non-repainting version of the classic TDI system. It works effectively in both trending and ranging markets, providing clear and actionable signals for forex traders. The simplicity of this indicator, combined with its advanced features, makes it ideal for improving trading accuracy while reducing manual analysis.
FAQ
3 Downloads
Published:
Feb 20, 2026 11:06 AM
Category: