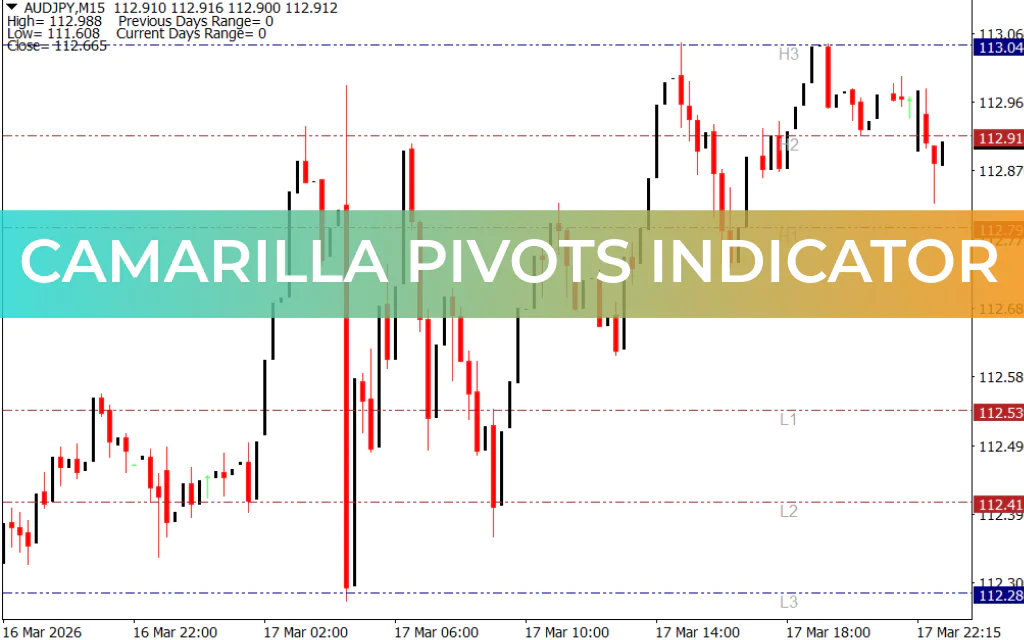
The Camarilla Pivots Indicator for MetaTrader 4 (MT4) is a popular technical analysis tool used to identify precise Support And Resistance levels in the forex market. It automatically plots multiple pivot levels on the chart, helping traders find potential entry and exit points with greater accuracy.
This indicator includes one central pivot point, along with four support levels and four resistance levels, giving traders a structured view of possible price movements throughout the trading session.
What Is the Camarilla Pivots Indicator?
The Camarilla Pivots Indicator calculates key support and resistance levels using the previous trading day’s price data, including:
- H – Previous day’s High
- L – Previous day’s Low
- C – Previous day’s Close
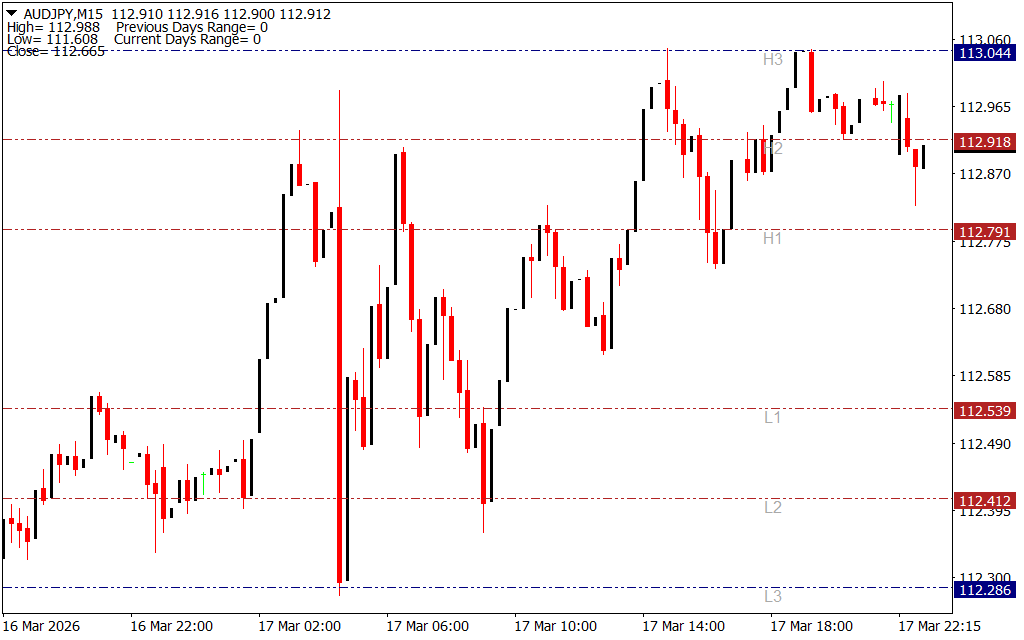
Based on these values, the indicator automatically draws eight important price levels on the chart:
Support Levels
- CL1
- CL2
- CL3
- CL4
Resistance Levels
- CH1
- CH2
- CH3
- CH4
Among these levels, CL3, CL4, CH3, and CH4 are considered the most important because they often signal breakouts or reversals.
Key Camarilla Pivot Levels Explained
- CL3 and CH3 – These are breakout levels. When the price moves beyond these levels, it often signals a strong trend continuation.
- CL4 and CH4 – These levels are typically used for counter-trend trades, where traders anticipate a potential price reversal.
Because the indicator is based on previous Price Action, it provides reliable reference points for identifying high-probability trading zones.
How to Use the Camarilla Pivots Indicator
The Camarilla Pivot system can be used in both trending and sideways markets. Most traders analyze the next session’s opening price to determine how the market may behave during the trading day.
Depending on where the price opens relative to the pivot levels, traders may:
- Trade reversions toward the mean
- Trade breakouts toward new highs or lows
For example:
- In a bullish market, traders often buy near support levels.
- In a bearish market, traders may sell near resistance levels.
Camarilla Pivots Trading Strategy
During strong market trends, Camarilla levels can help traders identify precise entry opportunities aligned with the trend direction.
Buy Setup
- Locate the CL3 level on the chart.
- Wait for the price candle to turn bullish.
- Enter a buy trade at CL3.
- Place a stop-loss at CL4.
- Set the take-profit target near CH1.
Sell Setup
- Locate the CH3 level on the chart.
- Wait for the price candle to turn bearish.
- Enter a sell trade at CH3.
- Place a stop-loss at CH4.
- Set the take-profit target near CL1.
Combining Camarilla Pivots with Other Indicators
While the Camarilla Pivots Indicator is powerful on its own, many traders improve accuracy by combining it with momentum indicators such as the Relative Strength Index (RSI).
Using additional confirmation tools can help filter false signals and improve overall trade quality.
Conclusion
The Camarilla Pivots Indicator for MT4 is an effective tool for identifying key support and resistance levels, potential breakouts, and reversal zones. By automatically plotting important pivot levels on the chart, it helps traders make faster and more informed trading decisions.
Whether you are trading trends or range-bound markets, this indicator can help improve trade timing, risk management, and market analysis when combined with other technical indicators.
FAQ
1 Download
Published:
Mar 17, 2026 18:19 PM
Category: