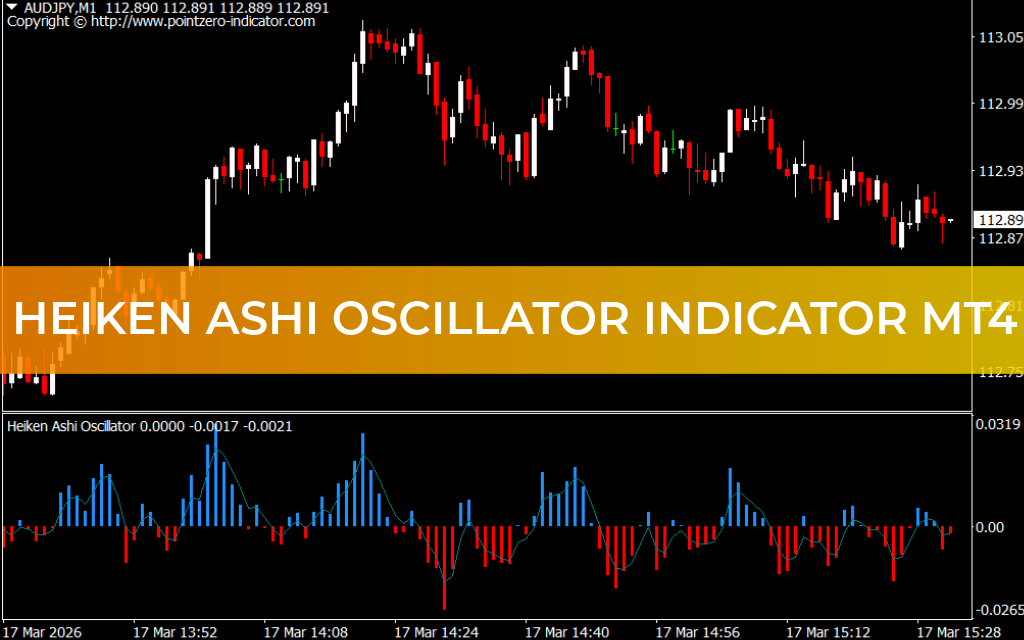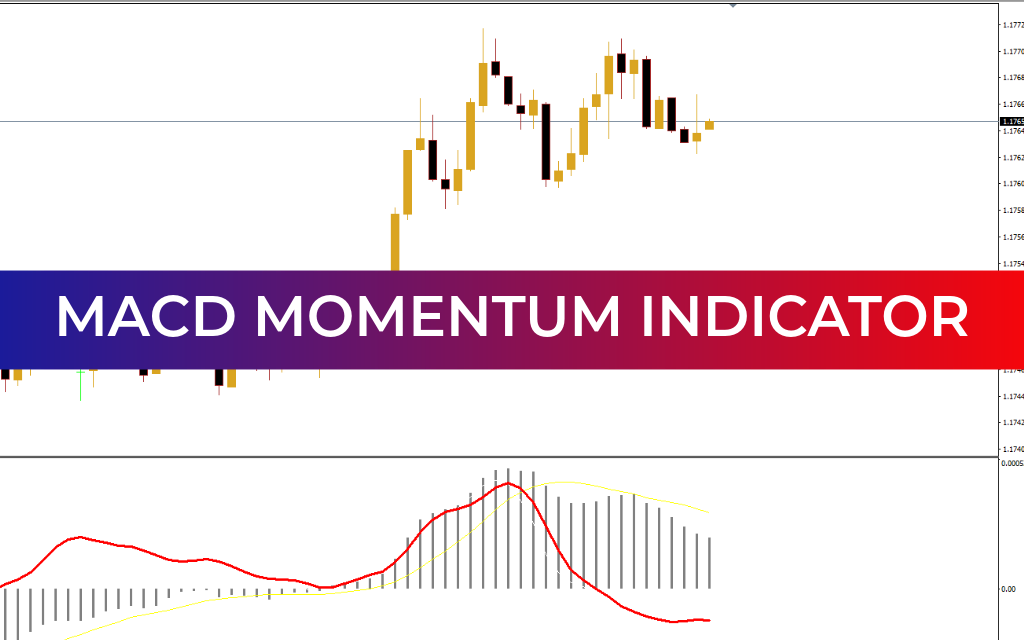
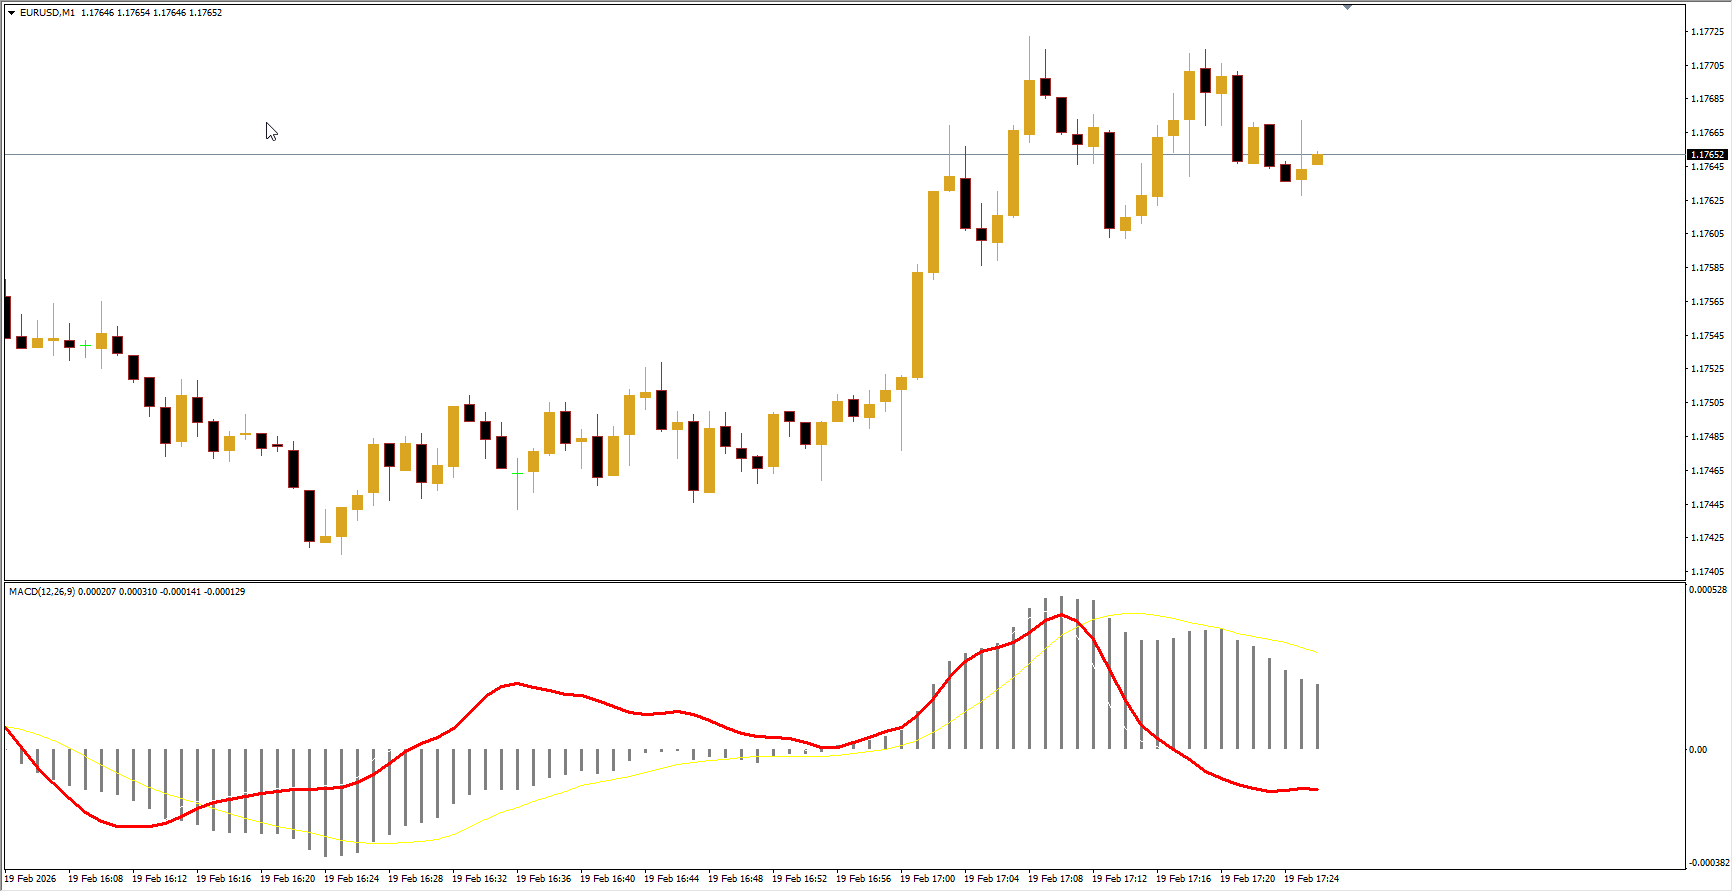
The MACD Momentum Indicator is a powerful technical analysis tool designed to measure market momentum by tracking the difference between simple and exponential moving averages of price. By using MACD histogram bars, the indicator visually displays the strength and direction of price momentum. Positive histogram values indicate bullish momentum, while negative values signal bearish momentum.
Widely trusted by both beginner and professional traders, the MACD Momentum Indicator is valued for its clear signal structure, straightforward interpretation, and practical application across various trading styles. Market professionals commonly use it for Scalping, intraday trading, and long-term trend analysis.
How to Trade with the MACD Momentum Indicator in MT4
The indicator is built around three key moving averages:
Signal SMA (9-period) — typically shown as a red line
Fast EMA (12-period) — commonly displayed in green
Slow EMA (26-period) — often represented in yellow
Bullish Momentum Setup
A bullish signal is confirmed when:
The MACD histogram turns positive
The fast EMA crosses above the signal SMA
The slow EMA remains below the other moving averages for confirmation
This alignment indicates strengthening upward momentum. Traders may consider entering a buy position and holding it until the histogram turns negative, signaling momentum weakening.
Bearish Momentum Setup
A bearish signal occurs when:
The MACD histogram turns negative
The fast EMA moves below both the signal SMA and slow EMA
This indicates downward momentum, suggesting a potential selling opportunity. Traders typically close short positions when the histogram shifts back into positive territory.
Trading Applications
The MACD Momentum Indicator is versatile and can be applied across:
Forex pairs
Stocks
Cryptocurrencies
CFDs
Multiple timeframes
Its ability to clearly identify momentum shifts makes it suitable for both trend-following and swing trading strategies. Many traders also integrate it with other indicators to enhance signal confirmation and overall trading performance.
Conclusion
The MACD Momentum Indicator is a reliable and easy-to-use momentum analysis tool for the MT4 platform. With its clear visual signals and adaptable framework, it helps traders identify Trend Strength, time entries and exits, and make informed trading decisions. Its simplicity and effectiveness make it especially valuable for beginners seeking technical guidance, as well as experienced traders looking to refine their market analysis.
FAQ
1 Download
Published:
Feb 19, 2026 10:29 AM
Category: