Free
Direction Indicator for MT4 – Trend Detection with Arrows, Lines, and Dots
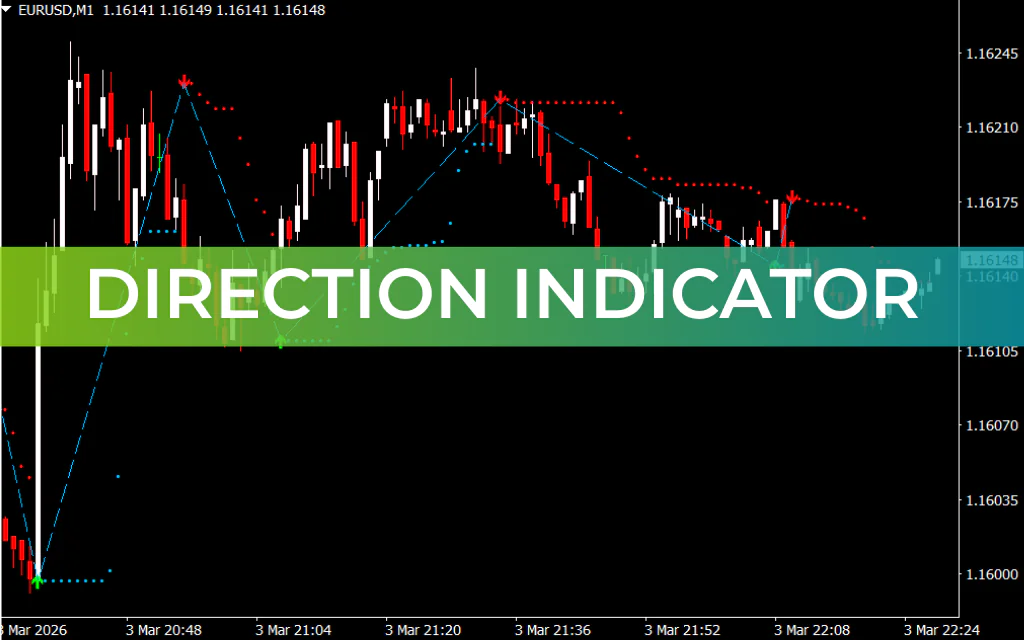
The Direction Indicator for MT4 is a trend-following tool that helps traders identify market direction, key Support And Resistance levels, and potential entry points. It uses a combination of arrows, lines, and dots to illustrate trend continuation and reversal zones.
- Arrows indicate strong bullish or bearish trends and act as buy/sell signals.
- Lines extend along the trend to show trend momentum.
Dots mark support and resistance levels, assisting in determining potential reversal areas.
Key Features
- Trend direction detection with arrows
- Trend continuation lines
- Support and resistance dots
- Buy and sell signals for trade entries
- Optimized for higher timeframes
How to Use the Direction Indicator for MT4
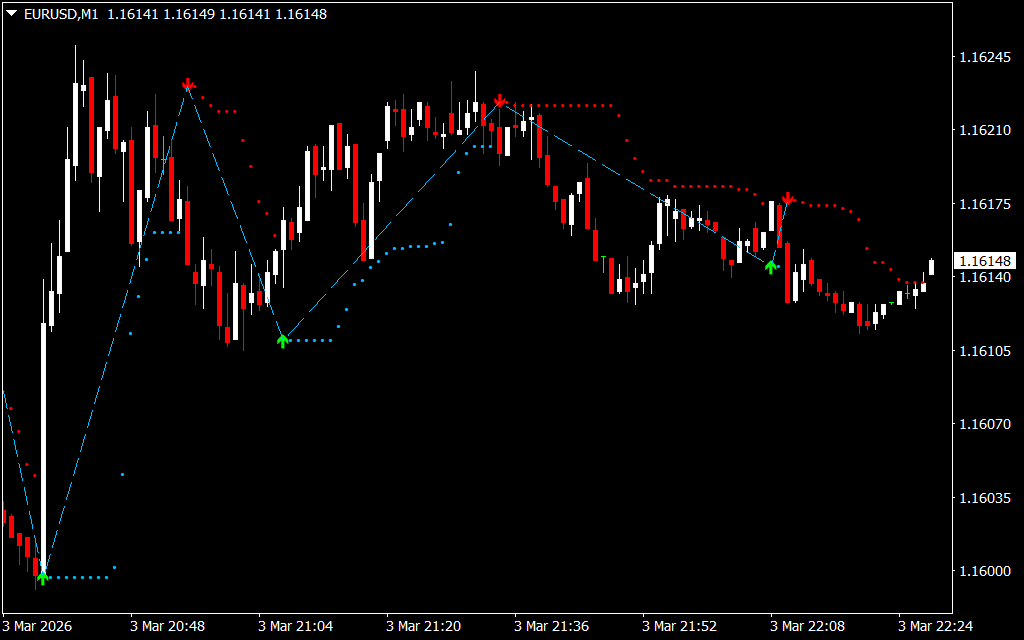
Step 1: Identify the Signal Arrow
- A green arrow signals a potential long (buy) opportunity.
- A red arrow signals a potential short (sell) opportunity.
Step 2: Confirm Trend Lines
- The lines extend along the direction of the trend.
- Use them to confirm that momentum is continuing before entering a trade.
Step 3: Use Dots as Support and Resistance
- The dots highlight key levels where price may reverse or stall.
- Combine the dots with arrows and lines to identify high-probability entry points.
Step 4: Apply Additional Confirmation
- The indicator can occasionally produce random arrows.
- Use other technical indicators or Price Action tools for confirmation before trading.
Best Practices
- Use on higher timeframes for more reliable signals.
- Combine arrows, lines, and dots to identify confluence areas.
- Avoid relying solely on the indicator in choppy or sideways markets.
Conclusion
The Direction Indicator for MT4 combines arrows, lines, and dots to provide a comprehensive view of the market. Arrows act as trend signals, lines show trend continuation, and dots mark key support and resistance levels, helping traders make informed decisions.
FAQ
Arrows indicate strong bullish or bearish trends and act as buy/sell signals. Lines extend along the trend to show momentum. Dots mark support and resistance levels for potential reversal areas. Trend-following tool.
Identify the signal arrow. Green arrow = potential long (buy) opportunity. Red arrow = potential short (sell) opportunity.
Step 2: Lines extend along the direction of the trend. Use them to confirm that momentum is continuing before entering a trade. Step 3: Use dots as support and resistance for reversal areas.
Optimized for higher timeframes. Helps identify market direction, key support and resistance levels, and potential entry points.
Trend direction. Key support and resistance. Potential entry points. Trend continuation and reversal zones.
Published:
Mar 03, 2026 16:29 PM
Category:
Share: