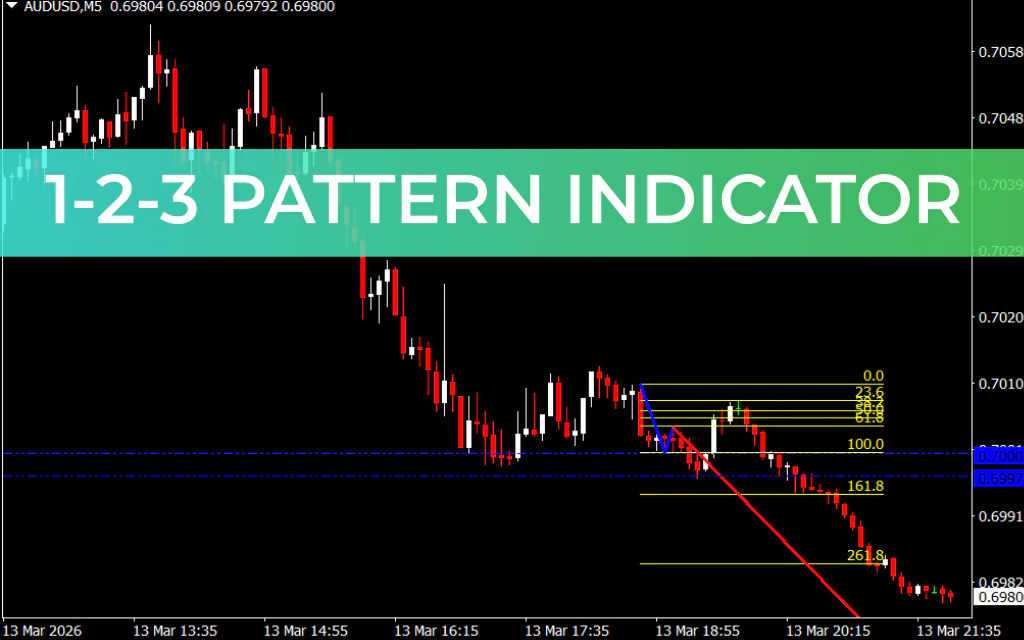
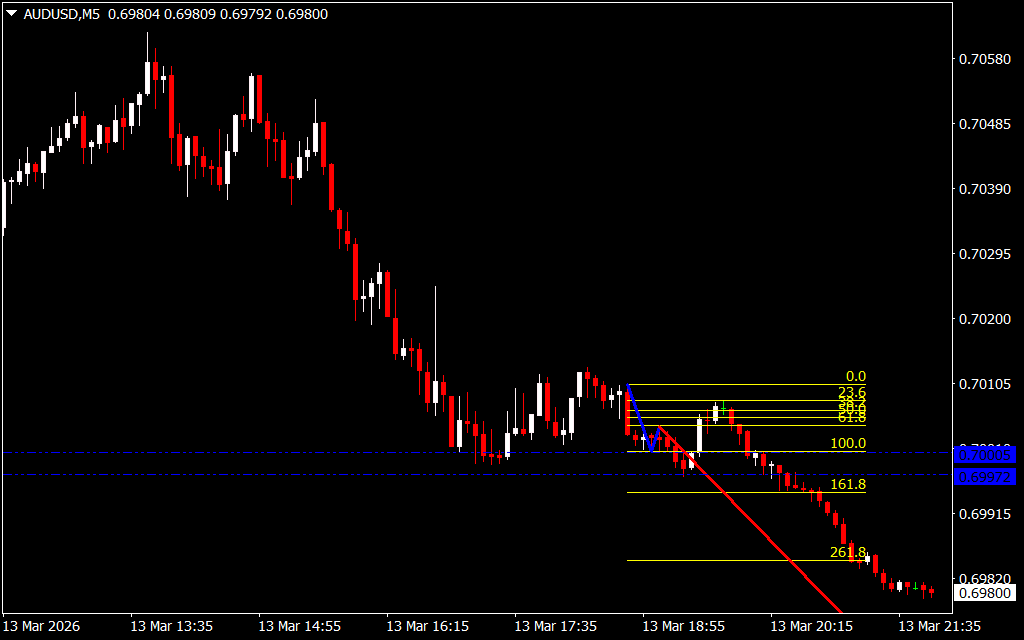
The 1-2-3 Pattern Indicator for MT4 is a powerful technical analysis tool that helps traders detect potential trend reversals using a structured three-point pattern. It automatically draws a non-repainting zigzag structure combined with Fibonacci levels, making it easier to analyze Price Action and identify possible entry and exit opportunities.
Designed for the MetaTrader 4 trading platform, this indicator is especially useful for traders who rely on price action strategies and trend-reversal setups.
What Is the 1-2-3 Pattern Indicator?
The 1-2-3 Pattern Indicator identifies a classic three-point reversal formation that usually appears at the end of a trend. The indicator draws a zigzag pattern with three important points:
- Point 1: High or low of the previous trend
- Point 2: First pullback level
- Point 3: Confirmation of a potential Trend Reversal
These points form the 1-2-3 structure, which traders often use to detect when a market is about to change direction.
To enhance accuracy, the indicator also adds five Fibonacci levels to the pattern. These levels act as dynamic Support And Resistance zones, helping traders better understand price behavior and possible breakout areas.
Key Features of the 1-2-3 Pattern Indicator
The indicator combines multiple analytical tools to simplify price action analysis.
Main Features
- Detects 1-2-3 reversal patterns automatically
- Draws a non-repainting zigzag structure
- Displays five Fibonacci retracement levels
- Identifies trend changes and trading signals
- Highlights support and resistance zones
- Works on all timeframes
Although it functions on any timeframe, many traders prefer using it on 5-minute to 30-minute charts, where short-term price movements are more active.
How the Indicator Works
The indicator analyzes Market Structure and price action to determine when a trend may be losing momentum.
It then draws:
- Zigzag lines connecting the three pattern points
- Fibonacci levels to highlight key price zones
- Color-coded signals that indicate trend direction
The color of the indicator lines changes depending on the market trend:
- Green line: Indicates a potential uptrend or buy opportunity
- Blue line: Indicates a downtrend or sell opportunity
When the market changes direction, the indicator may switch colors, alerting traders that the trend could be reversing.
How to Trade with the 1-2-3 Pattern Indicator
This indicator helps traders identify entry points, exit levels, and potential reversals by combining zigzag pattern detection with Fibonacci support and resistance levels.
Buy Setup
Follow these steps when the indicator signals a bullish trend:
- The indicator should show an uptrend signal.
- Wait until the trend structure fully develops.
- Enter a buy trade near the point where the indicator begins plotting the bullish move.
- Place a stop-loss below the recent swing low.
- Exit the trade if the price falls below the indicator line or if the trend weakens.
Sell Setup
Use this setup when the indicator signals a bearish trend:
- The indicator should indicate a downtrend.
- Wait until the pattern is fully formed.
- Enter a sell trade near the start of the bearish move.
- Place a stop-loss above the recent swing high.
- Exit the trade if the price moves above the indicator line.
Why Traders Use the 1-2-3 Pattern Indicator
The 1-2-3 pattern is widely used in technical analysis because it helps traders recognize trend exhaustion and potential reversals early.
Key benefits include:
- Clear visualization of market structure
- Reliable non-repainting signals
- Built-in Fibonacci support and resistance levels
- Works well with price action strategies
- Suitable for Scalping, day trading, and swing trading
By combining pattern recognition and Fibonacci analysis, this indicator provides a structured approach to spotting high-probability trading opportunities.
Conclusion
The 1-2-3 Pattern Indicator for MT4 is a valuable tool for traders looking to identify trend reversals and key price levels. With its non-repainting zigzag pattern and integrated Fibonacci levels, it simplifies price action analysis and helps traders make more informed decisions.
Whether you are a beginner or an experienced trader, this indicator can help you better understand market structure and potential entry points.
FAQ
Published:
Mar 15, 2026 18:33 PM
Category: