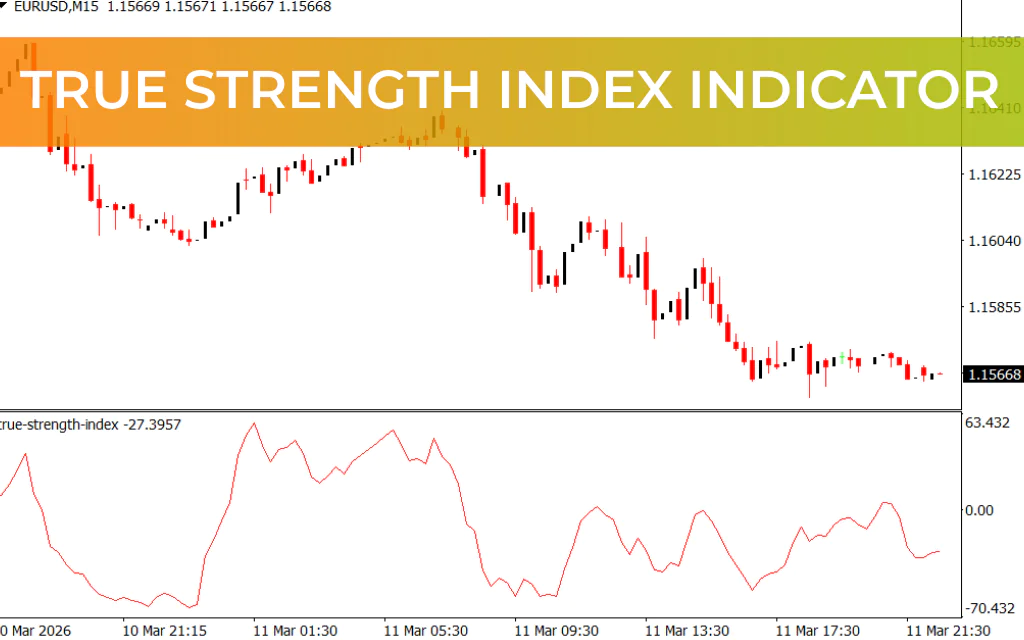
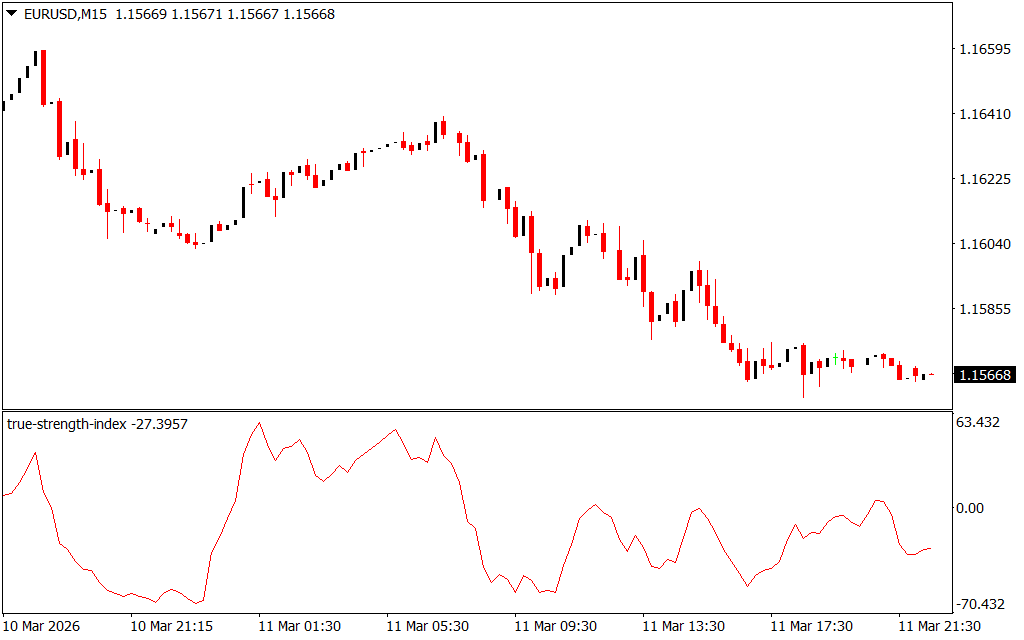
The True Strength Index (TSI) Indicator for MetaTrader 4 (MT4) is a momentum-based technical tool designed to help traders analyze the strength and direction of a market trend. Unlike standard oscillators, TSI focuses on price momentum changes, providing a clearer view of whether an asset is gaining bullish or bearish momentum.
This makes the indicator ideal for Scalping, intraday, and swing trading, and it is equally suitable for both novice and experienced traders.
How the True Strength Index Works
The True Strength Index is a simple yet effective oscillator. Its key principle is based on a centerline at 0.00, which indicates the direction of momentum:
- Above 0.00 – The market has bullish momentum
- Below 0.00 – The market has bearish momentum
The indicator is almost lag-free and highly sensitive to price movements, which allows traders to detect shifts in momentum early.
Unlike signal-generating indicators, the TSI does not directly provide BUY or SELL alerts. Instead, it serves as a tool to measure the strength of a trend and confirm trade decisions.
Key Features of the True Strength Index
The True Strength Index offers several advantages:
- Tracks momentum changes of tradable assets
- Identifies bullish and bearish Trend Strength
- Can highlight potential overbought and oversold zones
- Suitable for all timeframes and trading styles
- Compatible with Price Action and other technical indicators
- Almost lag-free and highly responsive to price movements
Because it does not provide direct trade signals, it is best used in conjunction with other indicators or as a confirmation tool for trade entries and exits.
How to Trade with the TSI Indicator
Using Momentum for Trade Decisions
- Bullish Momentum – When the TSI line is above 0.00, the asset shows upward strength. Traders may look for buy opportunities using price action or other confirmation tools.
- Bearish Momentum – When the TSI line is below 0.00, the asset shows downward strength. Traders may look for sell opportunities in line with additional technical signals.
Overbought and Oversold Zones
While the TSI can indicate overbought or oversold conditions, it does not come with predefined limits, so interpreting these zones requires experience and context from other technical indicators.
Combining TSI with Other Indicators
For more precise trade entries, traders often pair the TSI with:
- Moving Averages (MA, EMA)
- Trend-following indicators (like MACD or ADX)
- Support And Resistance levels
- Price action patterns
Using the TSI as a confluence tool improves decision-making and reduces the likelihood of false signals.
Conclusion
The True Strength Index (TSI) Indicator for MT4 is an essential tool for traders who want to monitor market momentum and trend strength accurately. It is easy to use, sensitive to price movements, and almost lag-free.
While it does not provide direct BUY/SELL signals, the TSI becomes powerful when combined with other technical indicators or price action strategies, helping traders identify profitable trading opportunities. Best of all, the indicator is free to download.
FAQ
1 Download
Published:
Mar 11, 2026 17:55 PM
Category: