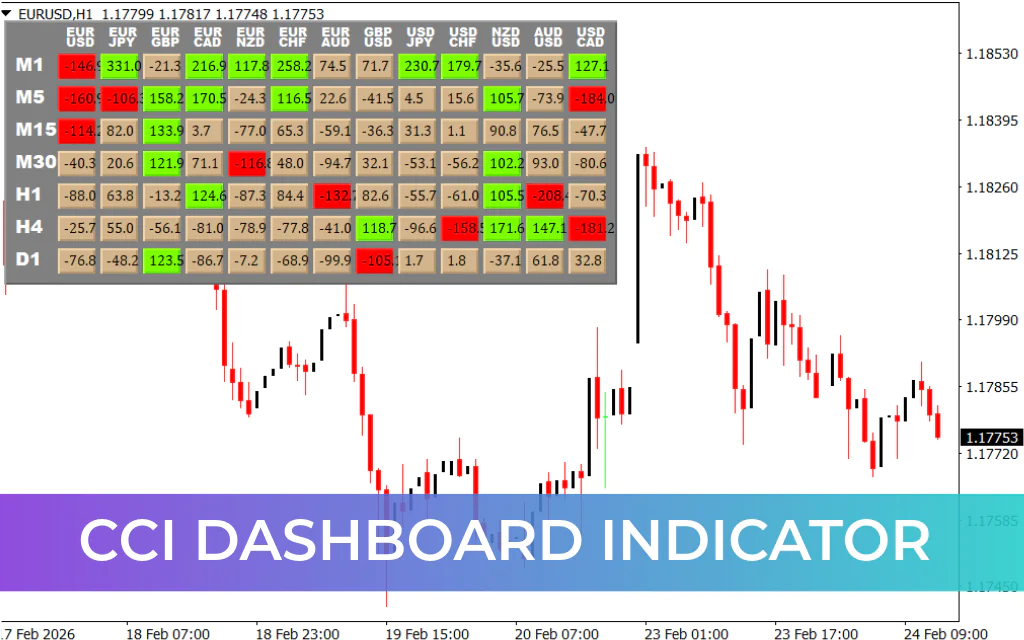
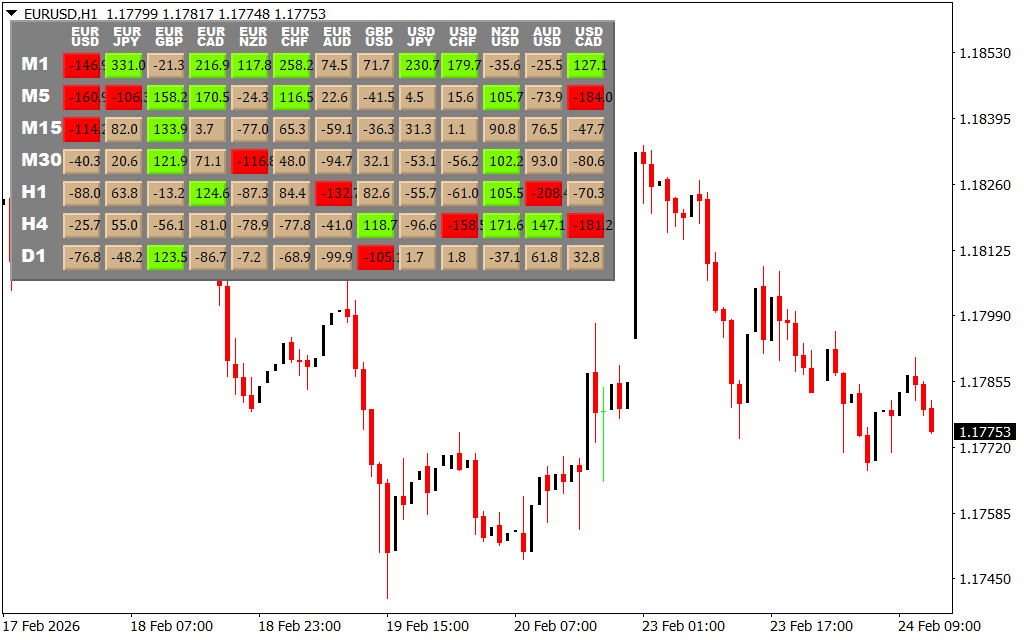
The CCI Dashboard Indicator is an essential tool for traders who want to monitor multiple currency pairs and timeframes simultaneously. By displaying Commodity Channel Index (CCI) values in a clean, visual dashboard, this indicator offers quick insights into overbought and oversold conditions, helping traders make faster, more informed decisions. Its versatility makes it ideal for identifying trends, reversals, and continuation patterns across different timeframes.
Key Features of the CCI Dashboard Indicator
- Multi-Pair and Multi-Timeframe Analysis: Monitor multiple currency pairs and timeframes in a single dashboard for efficient trading.
- Clear Visual Signals: Green rectangles indicate bullish conditions, red for bearish, and tan for neutral zones.
- Overbought and Oversold Alerts: Quickly spot potential reversals or continuation opportunities based on CCI values.
- Real-Time Updates: Stay informed of market changes as they happen for timely trading decisions.
- Customizable Layout: Adjust the dashboard to display preferred currency pairs, timeframes, and thresholds.
Why Traders Use CCI Dashboard Indicator
The CCI Dashboard Indicator streamlines complex market data, making multi-timeframe and multi-pair analysis effortless. Whether you follow Forex market analysis reports, use trading journal templates, or complement other tools like the Head & Shoulders Indicator, this dashboard ensures you stay informed across all your trades. It is perfect for scalpers, day traders, and swing traders who require a quick yet comprehensive view of the market.
Conclusion
For traders who need a fast, reliable overview of multiple currency pairs and timeframes, the CCI Dashboard Indicator is indispensable. Its intuitive visual layout, real-time updates, and customizable settings allow you to make confident trading decisions and identify high-probability opportunities. Download the CCI Dashboard Indicator today to enhance your multi-timeframe trading strategy.
FAQ
3 Downloads
Published:
Feb 24, 2026 07:17 AM
Category: