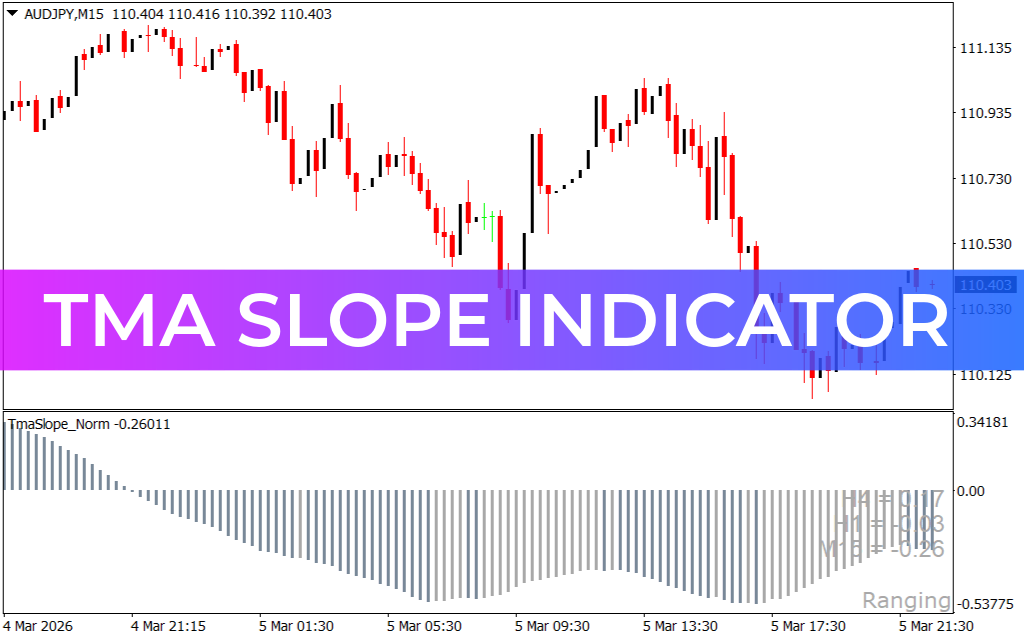
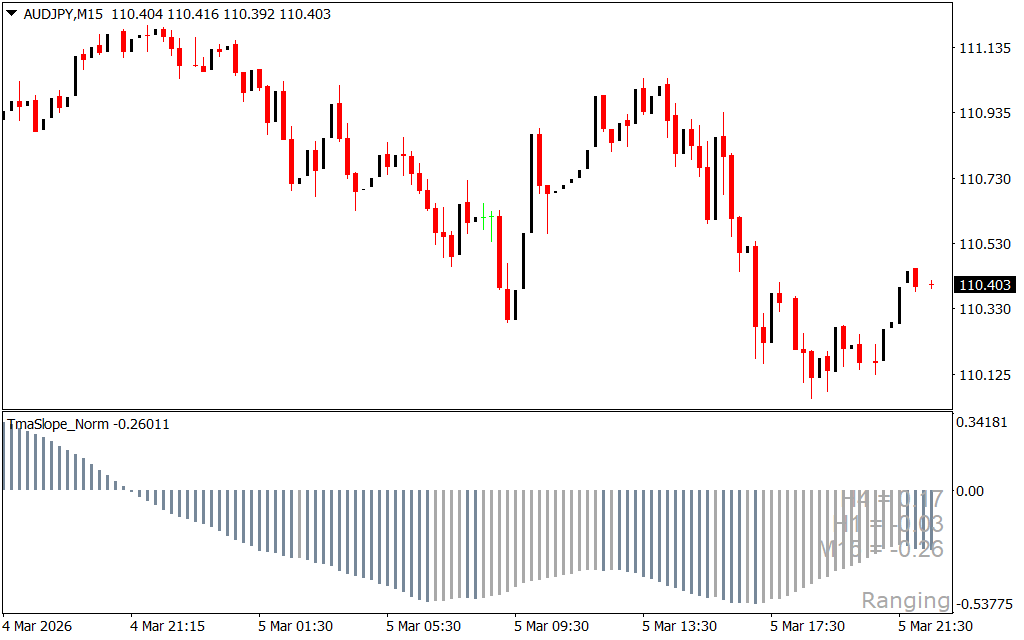
The TMA Slope Indicator for MT4 is a trend-following oscillator that generates trading signals using the Triangular Moving Average (TMA). The indicator displays a color-coded histogram that helps traders quickly identify bullish, bearish, and neutral market conditions.
Because it provides clear visual signals, the TMA Slope Indicator is suitable for both beginner and experienced forex traders. However, traders should use additional indicators or Price Action analysis for confirmation because the indicator can repaint under certain conditions.
Key Features of the TMA Slope Indicator
- Color-Coded Histogram – Green bars indicate bullish momentum, red bars show bearish momentum, and gray bars represent neutral market conditions.
- Trend Momentum Detection – Helps traders identify the strength and direction of the current market trend.
- Simple Visual Signals – Easy to interpret even for beginner traders.
- Multi-Timeframe Compatibility – Works on different timeframes, from Scalping charts to higher-timeframe analysis.
How to Trade Using the TMA Slope Indicator
On the chart, the indicator appears in a separate window as a histogram with three colors.
Buy Signal
- When the histogram turns green, it signals bullish momentum.
- Traders can consider opening buy positions in alignment with the uptrend.
Sell Signal
- When the histogram turns red, it indicates bearish momentum.
- Traders can look for sell opportunities following the downtrend.
Neutral Market
- When the histogram turns gray, the market is in a sideways or indecisive phase.
- It is generally best to avoid trading during this period until a clear direction appears.
Since the TMA Slope indicator may repaint, traders should confirm signals using trendlines, support/resistance levels, or additional technical indicators.
Conclusion
The TMA Slope Indicator for MT4 is a useful tool for traders who rely on Triangular Moving Average-based analysis. With its clear histogram signals, traders can quickly identify market trends and momentum. However, because the indicator may repaint, combining it with other technical analysis tools can help improve trading accuracy and reliability.
FAQ
Published:
Mar 05, 2026 16:42 PM
Category: