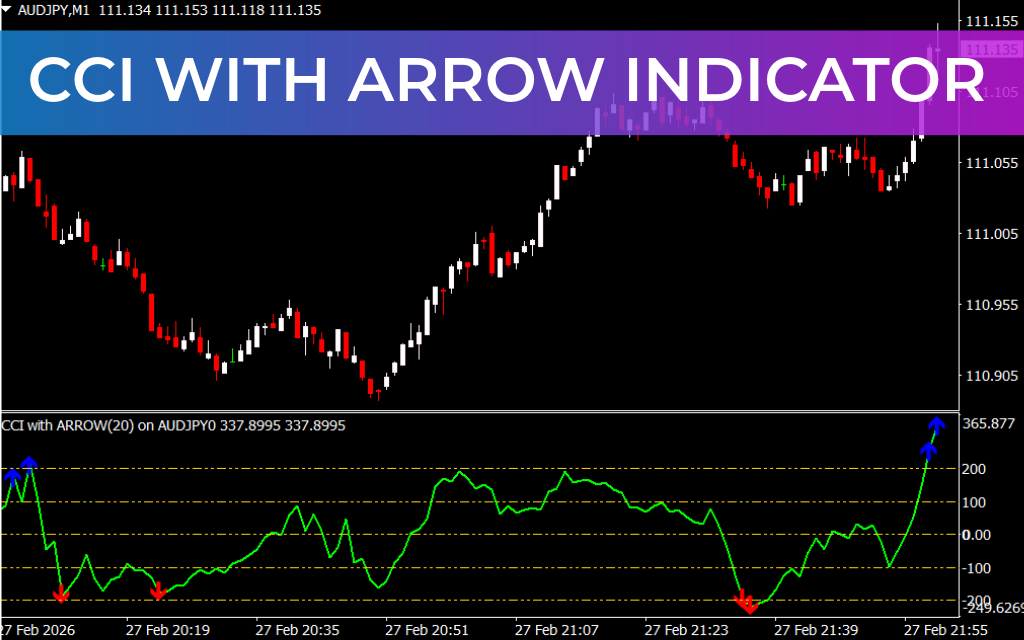
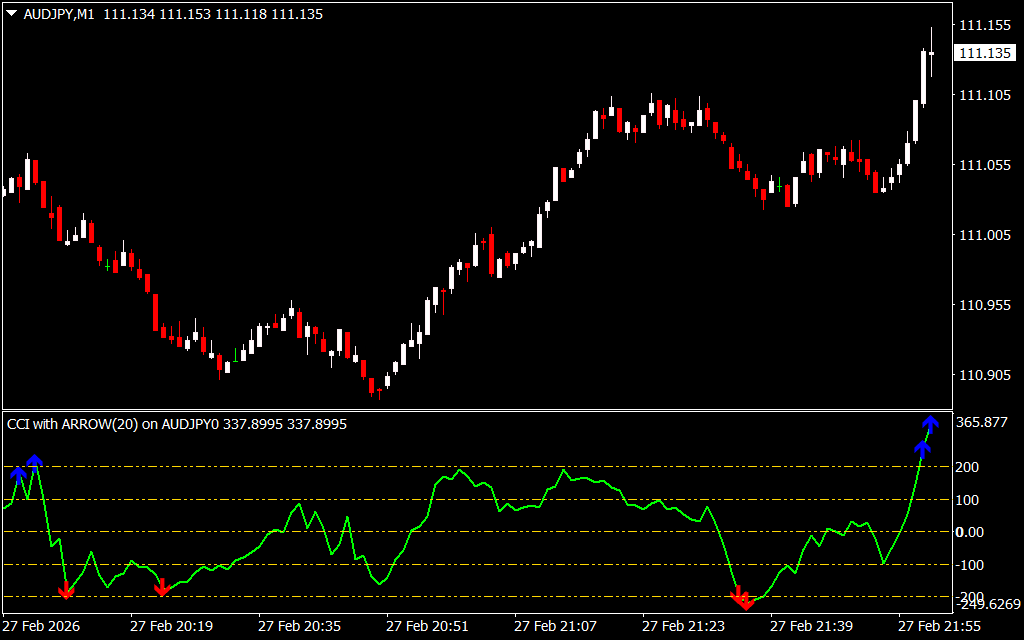
The CCI with Arrow Indicator for MetaTrader 4 (MT4) is a momentum-based trading tool built around the Commodity Channel Index (CCI). It enhances the standard CCI by adding visual buy and sell arrows, making trade entries easier to identify.
This indicator is designed to help traders detect optimal entry zones when a strong trend condition is established. It can be used for both short-term and long-term trading opportunities and works across multiple timeframes.
How the CCI with Arrow Indicator Works
The CCI oscillator fluctuates around a zero line, which defines the market’s general trend bias:
- Above 0 → Bullish bias
- Below 0 → Bearish bias
Key Signal Levels
- Above +100 → Strong bullish momentum
- Below -100 → Strong bearish momentum
Arrow Signals
- Blue Arrow (Buy Signal):
- Appears when the CCI crosses above +100
- Indicates strong bullish momentum
- Red Arrow (Sell Signal):
- Appears when the CCI crosses below -100
- Indicates strong bearish momentum
Trading Strategy
✔ Buy Setup
- CCI crosses above +100
- Blue arrow appears
- Market Structure supports bullish continuation
- Enter buy position
- Place stop loss below recent swing low
✔ Sell Setup
- CCI drops below -100
- Red arrow appears
- Market confirms bearish pressure
- Enter sell position
- Place stop loss above recent swing high
Best Practice
The indicator performs best when trading in the direction of the primary trend. It is particularly useful for:
- Entering after a minor pullback in a trending market
- Confirming momentum strength
- Scalping and intraday trading
For higher probability setups, combine it with:
- Trend filters (e.g., moving averages)
- Support And Resistance levels
- Price Action confirmation
Benefits of the CCI with Arrow Indicator
- Clear visual buy/sell arrows
- Easy-to-interpret momentum signals
- Works across multiple timeframes
- Suitable for beginners and advanced traders
- Effective in strong trending conditions
Conclusion
The CCI with Arrow Indicator for MT4 is a practical momentum tool that highlights buy and sell entry zones during strong trend conditions. While it provides straightforward visual signals, combining it with trend analysis and proper risk management significantly improves trading performance.
FAQ
Published:
Mar 01, 2026 17:20 PM
Category: