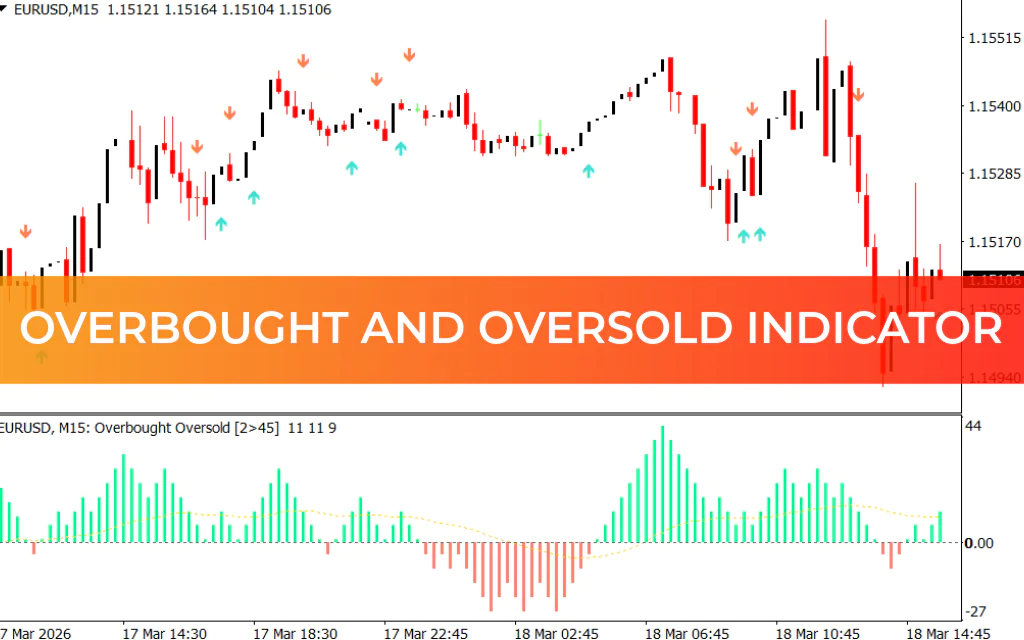
The Overbought and Oversold (OB/OS) Indicator for MetaTrader 4 is a versatile trading tool designed to help forex traders identify potential trend exhaustion zones. It provides arrow-based signals on the chart and a histogram in a separate window, making it suitable for both novice and advanced traders.
How the Indicator Works
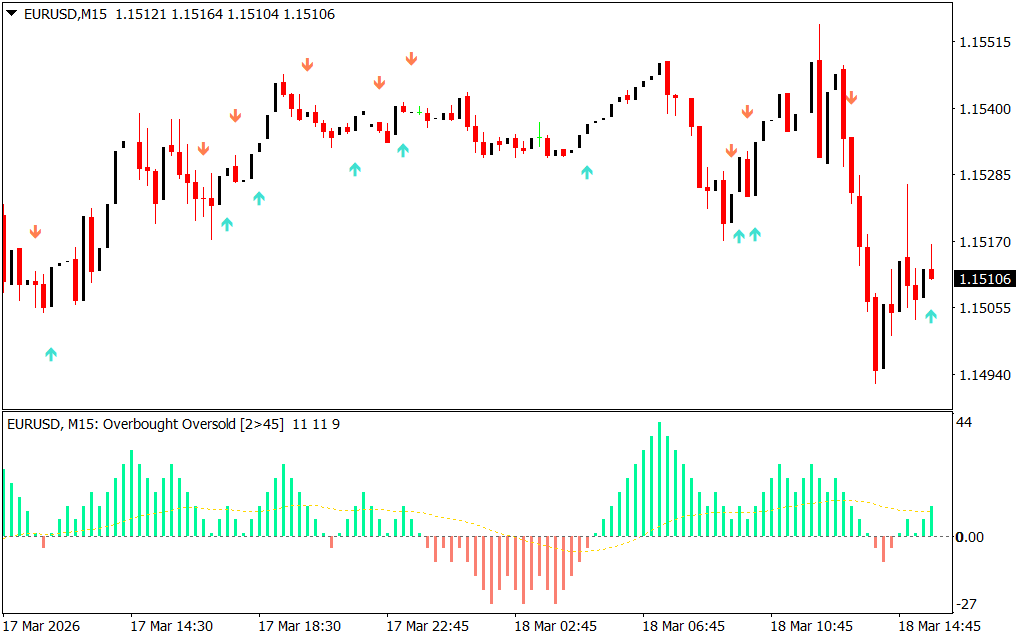
- Arrow Signals:
- Green arrows indicate bullish opportunities.
- Red arrows indicate bearish opportunities.
- Histogram Signals:
- Green bars represent a bullish market trend.
- Red bars represent a bearish market trend.
- The histogram can be used to filter trades—traders avoid counter-trend signals (e.g., ignoring sell arrows when the histogram is green).
- Zero Line Cross:
- More stable, long-term signals occur when the histogram crosses the zero line.
- Buy Signal: Histogram turns green above the zero line.
- Sell Signal: Histogram turns red below the zero line.
- Stop-loss is set below the previous swing low for buys, and above the previous swing high for sells.
Trading Strategy
- Entry:
- Wait for an Arrow Signal aligned with the histogram color.
- Confirm with the zero-line cross for stronger signals.
- Exit:
- Close the trade when the arrow signals an opposite direction.
- Alternatively, exit when the histogram changes color and crosses the zero line.
- Trend Riding:
- Positions can be held as long as the histogram remains above (bullish) or below (bearish) the zero line.
- This allows traders to maximize profits during sustained trends.
Benefits
✅ Provides dual signals (arrows + histogram) for confirmation.
✅ Works on all intraday, daily, weekly, and monthly charts.
✅ Reduces false trades by filtering signals against the histogram trend.
✅ Offers zero-line cross signals for stronger, long-term trades.
✅ Suitable for both new and experienced traders.
Conclusion
The Overbought and Oversold Indicator for MT4 combines multiple signal types to give forex traders clear entry and exit points. By using arrow signals alongside the histogram and zero-line crosses, traders can filter false signals, ride trends, and improve accuracy in both short-term and long-term trades.
FAQ
1 Download
Published:
Mar 18, 2026 10:51 AM
Category: