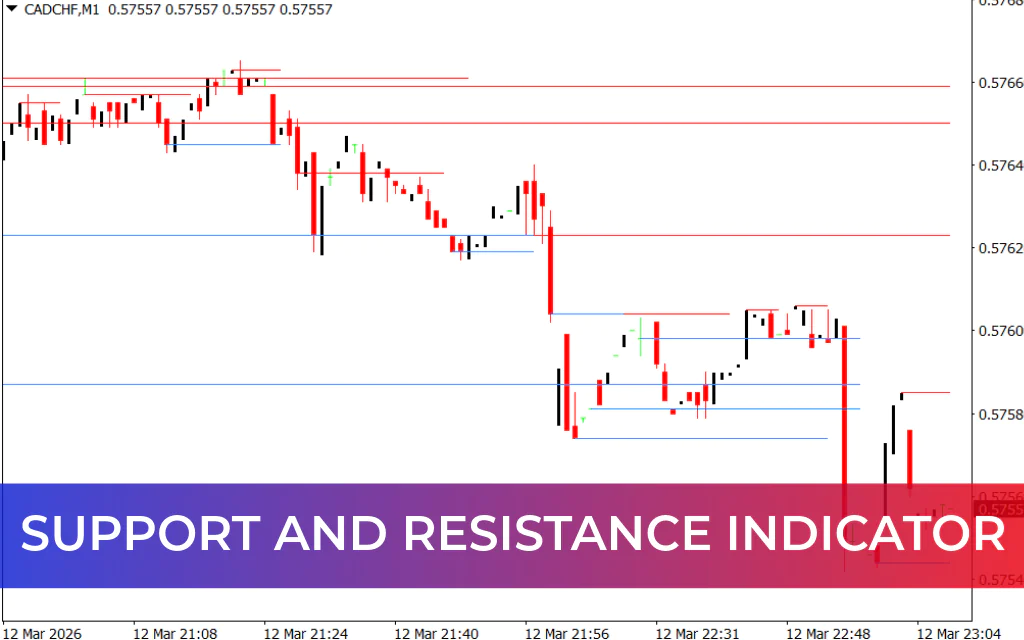
The Support And Resistance Indicator for MT4 is a technical analysis tool that automatically identifies and plots support and resistance zones on your chart. These levels are among the most widely used trading concepts in the financial markets because they highlight areas where price may reverse, pause, or break out.
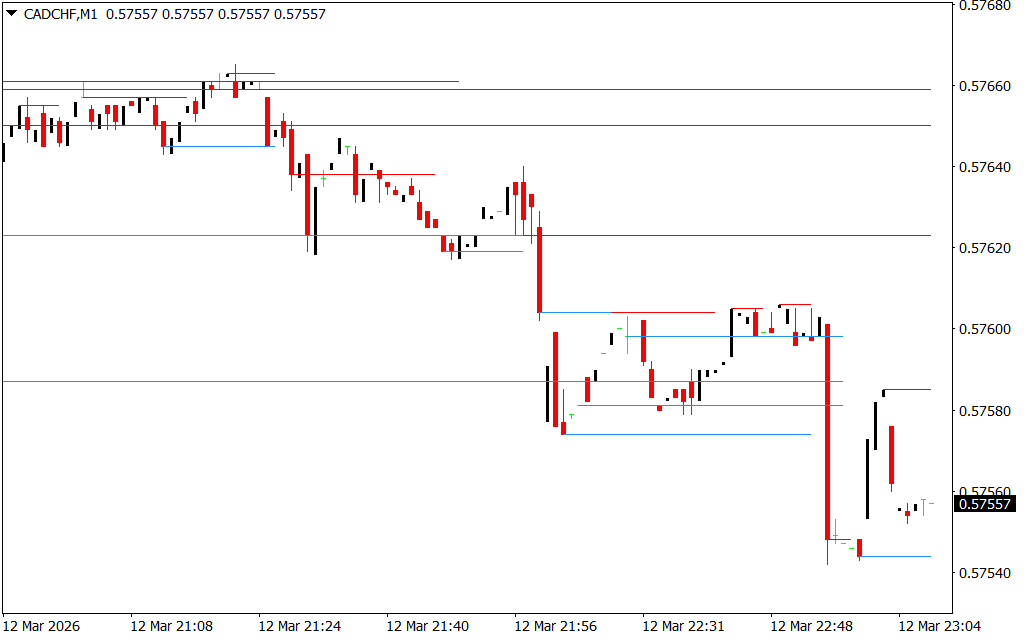
This indicator is a multi-timeframe (MTF) tool, meaning it scans several timeframes and displays their support and resistance levels on the current chart. For example, when using an H4 chart, the indicator may display support and resistance levels from H4, Daily (D1), Weekly (W1), and Monthly (MN) timeframes.
By automatically drawing these zones, the indicator saves traders time and simplifies technical analysis. It is suitable for Scalping, intraday trading, and swing trading, and can be used by both beginners and experienced traders.
How Support and Resistance Levels Are Identified
Support and resistance zones typically form at key price levels where the market previously reversed. These include:
- Support Levels: Formed around previous lows where price tends to bounce upward.
- Resistance Levels: Formed around previous highs where price tends to move downward.
- Psychological Levels: Rounded numbers such as 1.2000, 1.3000, or 1.5000 that often act as strong market barriers.
How the Indicator Displays Support and Resistance
On the chart, the indicator automatically draws:
- Red lines: Represent resistance zones
- Dodger blue lines: Represent support zones
These lines come from multiple timeframes, giving traders a broader view of important price levels.
How to Trade Using the Support and Resistance Indicator
Trend Reversal Strategy
Traders can look for price rejection or reversal patterns at support and resistance zones.
- Buy Setup: When price bounces from a support zone
- Sell Setup: When price rejects a resistance zone
Candlestick patterns like pin bars, engulfing patterns, or doji candles can confirm the reversal.
Breakout and Continuation Strategy
Sometimes price breaks through support or resistance instead of reversing.
- A broken resistance can become a new support level
- A broken support can become a new resistance level
Traders may enter trades in the direction of the breakout when price retests the broken level.
Advantages of the Support and Resistance Indicator
- Automatically detects support and resistance zones
- Displays levels from multiple timeframes
- Helps identify trend reversals and breakouts
- Suitable for scalping, intraday, and swing trading
- Saves time by eliminating manual chart drawing
- Ideal for both beginner and advanced traders
- Free to download and install on MT4
Conclusion
The Support and Resistance Indicator for MT4 simplifies technical analysis by automatically highlighting key price levels across multiple timeframes. These zones help traders identify high-probability entry and exit points, whether trading reversals or breakouts. With its automatic detection and multi-timeframe functionality, the indicator is a valuable addition to any trading strategy.
FAQ
3 Downloads
Published:
Mar 12, 2026 18:09 PM
Category: