The Forex market often forms recognizable price patterns that resemble specific shapes on the chart. Surprisingly, these shapes are not random—they provide valuable insights into potential market movements. Traders use these patterns to anticipate price direction and make profitable trading decisions.
Price patterns emerge due to the interaction between buyers and sellers in the market. Over time, many of these formations have been historically tested and proven to provide a statistical edge. By learning to recognize them, traders can identify possible trend continuations or reversals before they fully develop.
However, identifying these patterns manually can be challenging. The Forex market moves quickly and often appears chaotic, making it difficult—especially for beginners—to spot patterns accurately. This is where the Price Patterns Indicator becomes extremely useful.
What Is the Price Patterns Indicator?
The Price Patterns Indicator is a technical tool designed to automatically scan price charts and detect common chart patterns. Once a pattern is identified, the indicator highlights and labels it directly on the chart, making it easier for traders to analyze potential trading opportunities.
The indicator can be used on any currency pair, providing flexibility for traders across multiple markets. While it functions on all timeframes, it generally performs best on higher timeframes such as the 4-hour, daily, and weekly charts, where patterns tend to be more reliable and less affected by short-term market noise.
How to Use the Price Patterns Indicator
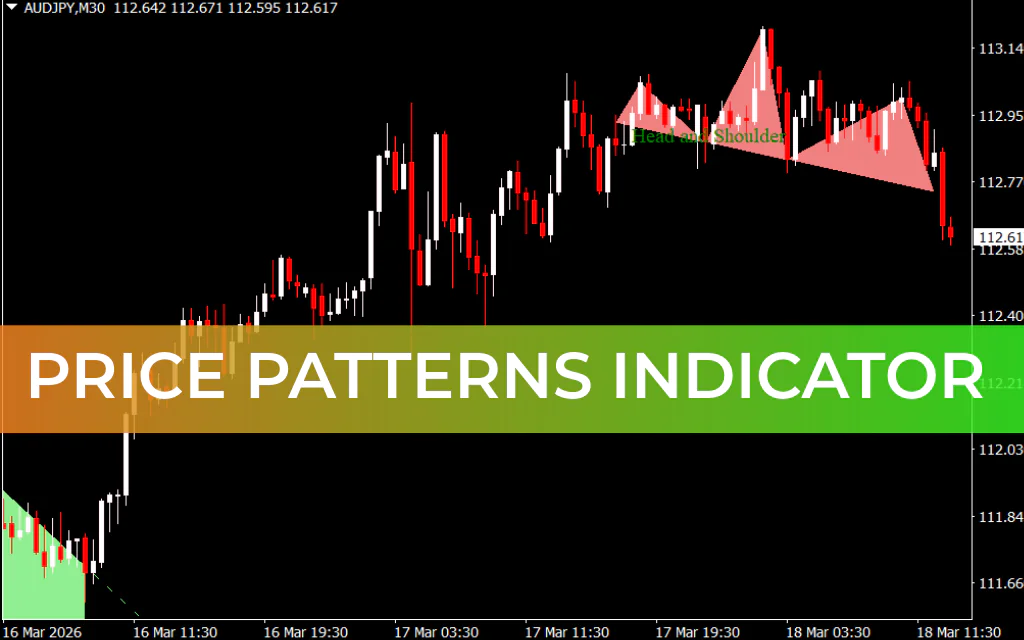
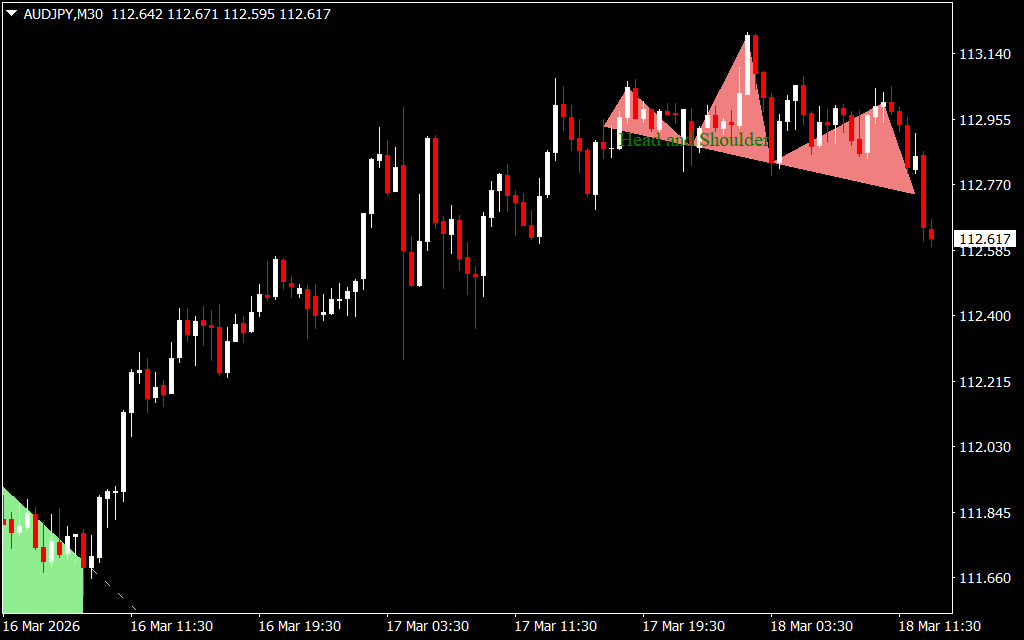
The Price Patterns Indicator continuously scans the chart to identify formations such as triangles, wedges, triple tops and bottoms, and head-and-shoulders patterns. Once detected, it visually marks these patterns so traders can quickly interpret potential signals.
Here are some common examples:
Triple Bottom Pattern
When a triple bottom forms near a strong support level, it often signals a potential bullish reversal. This means buyers may be gaining strength, making it a possible buy opportunity.
Triangle Pattern in an Uptrend
Triangles that appear during an existing uptrend typically signal trend continuation. Traders often prepare to buy or add positions once the price breaks out of the pattern.
Head and Shoulders Pattern
The head and shoulders pattern is a well-known bearish reversal signal. When this formation appears, it suggests the uptrend may be ending and a downward move could follow, creating a potential sell opportunity.
Trading Example
Consider a chart showing the price movement of the USD/JPY currency pair. In one instance, the chart forms a rising wedge pattern, highlighted by a shaded green area. A rising wedge often signals trend continuation. After the wedge formed, the price continued moving upward significantly.
Later, the chart develops a head-and-shoulders pattern, highlighted by a light coral shaded area. This pattern typically indicates a potential shift from a bullish market to a bearish one. When this occurs, sellers may begin to dominate the market.
In such a scenario, traders may consider placing a sell order, with a stop-loss positioned above the head, which represents the highest peak of the formation.
Final Thoughts
The Price Patterns Indicator is a powerful tool for traders who rely on Price Action analysis. It simplifies the process of identifying complex chart patterns and saves valuable time by automatically scanning the market.
Instead of memorizing and manually searching for every pattern, traders can rely on the indicator to highlight opportunities directly on the chart. When combined with proper risk management and a solid trading strategy, the Price Patterns Indicator can become a valuable addition to any Forex trader’s toolkit.
FAQ
3 Downloads
Published:
Mar 18, 2026 08:32 AM
Category: