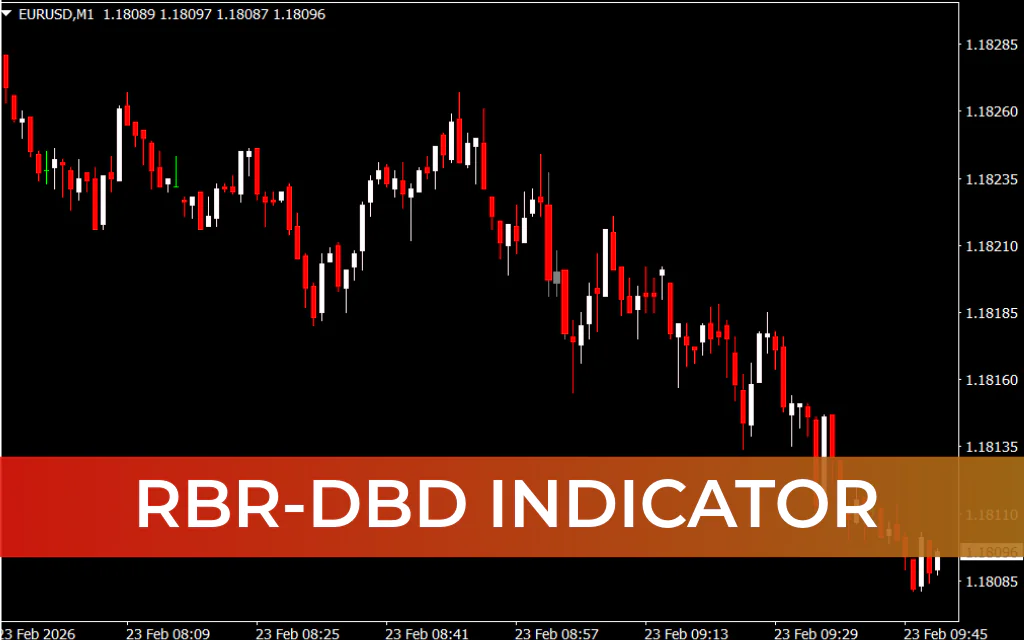
The RBR-DBD Indicator for MetaTrader 4 is a lightweight yet powerful pattern-recognition tool that automatically detects and marks Rally-Base-Rally (RBR) and Drop-Base-Drop (DBD) formations directly on your chart. These continuation structures are core components of Supply And Demand trading and are widely used within Smart Money Concept (SMC) strategies.
Unlike reversal formations such as DBR or RBD, RBR and DBD patterns signal strong trend continuation, often driven by institutional accumulation or distribution. This indicator removes the need for manual pattern marking, helping traders quickly identify high-probability continuation zones with precision and clarity.
What Are RBR and DBD Patterns?
- Rally-Base-Rally (RBR) – A strong bullish impulse followed by a brief consolidation (base), then another upward expansion.
- Drop-Base-Drop (DBD) – A strong bearish impulse, a short consolidation phase, then continued downward movement.
The “base” typically consists of small-bodied candles, tight ranges, or inside bars, representing temporary equilibrium before the dominant trend resumes.
These zones often indicate areas where institutional orders remain partially unfilled, making them strategic entry points for continuation trades.
RBR-DBD Indicator Trading Signals
The indicator automatically highlights detected patterns with clear color coding:
- DeepSkyBlue Zones – Mark Rally-Base-Rally formations, signaling bullish continuation potential.
- Red Zones – Identify Drop-Base-Drop formations, indicating bearish continuation pressure.
When price revisits these zones, traders often look for confirmation signals such as:
- Bullish or bearish rejection candles
- Volume spikes
- Break-of-structure confirmation
- Confluence with order blocks or Liquidity Zones
Because these formations represent trend “engine rooms,” they are particularly effective in trending markets and momentum-driven environments.
Key Benefits
1. Automatic Pattern Detection
No manual drawing required—RBR and DBD zones are identified instantly.
2. Clear Visual Structure
Color-coded zones simplify continuation trade planning.
3. Smart Money Alignment
Designed for supply & demand and SMC-based strategies.
4. Multi-Timeframe Compatibility
Works effectively for Scalping, intraday, and swing trading.
5. High-Probability Continuation Zones
Focuses on Trend Strength rather than reversal guessing.
How to Use the Indicator Effectively
- Trade in the direction of the higher timeframe trend.
- Wait for price to retrace into a marked RBR or DBD zone.
- Look for confirmation (structure break, strong rejection, volume confluence).
- Place stops beyond the base structure for structured risk management.
Combining the indicator with liquidity analysis or order block tools can significantly improve accuracy.
Conclusion
The RBR-DBD Indicator for MT4 is an essential tool for traders who want to capitalize on strong continuation moves driven by institutional order flow. By automatically identifying Rally-Base-Rally and Drop-Base-Drop formations, it allows traders to focus on execution rather than chart drawing.
Whether you trade short-term momentum or longer-term trends, this indicator helps you spot high-probability continuation zones with clarity and confidence.
FAQ
7 Downloads
Published:
Feb 23, 2026 03:54 AM
Category: