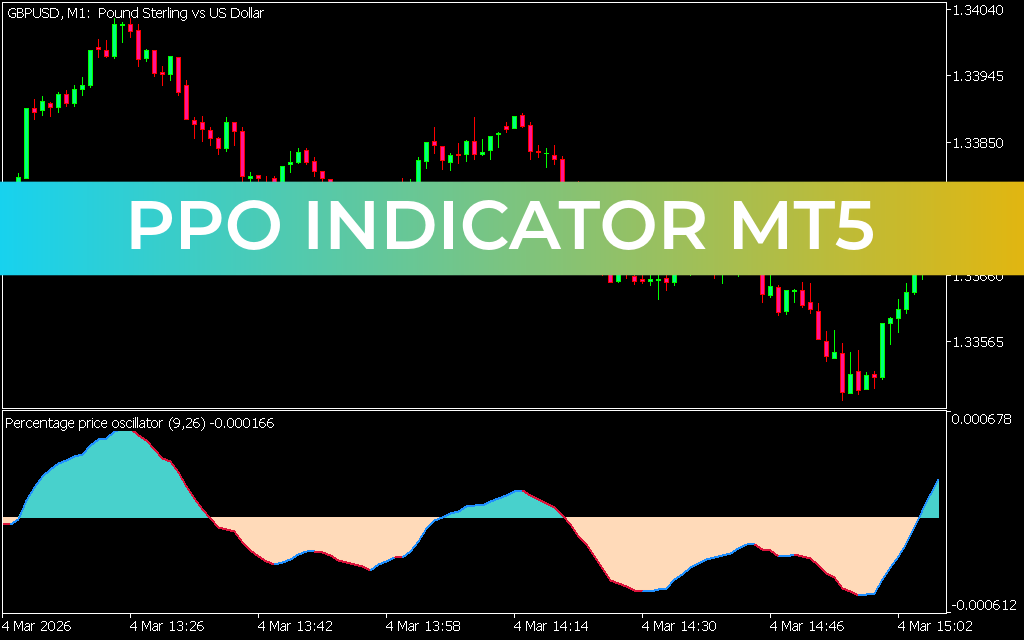
The Percentage Price Oscillator (PPO) Indicator for MT5 is a powerful momentum trading tool that works similarly to the classic MACD indicator. It helps traders analyze trend direction, momentum strength, and potential market reversals.
Unlike MACD, which measures the absolute difference between moving averages, the PPO calculates this difference as a percentage, making it more standardized across different price levels and assets.
What is the PPO Indicator?
The PPO Indicator is a momentum-based technical tool that compares two moving averages and expresses their difference in percentage terms.
It is widely used to:
- Identify trend direction
- Detect bullish and bearish momentum
- Spot divergences and reversals
- Confirm market strength or weakness
Because of its similarity to MACD, it is easy for traders to understand and apply.
How Does the PPO Indicator Work?
The PPO Indicator consists of:
- PPO Line
- Signal Line
- Zero Line
These components help traders interpret market conditions:
- PPO above zero → bullish trend
- PPO below zero → bearish trend
- Crossovers → potential trade signals
PPO vs MACD – Key Difference
The main difference between PPO and MACD is:
- MACD → measures absolute difference between moving averages
- PPO → measures percentage difference between moving averages
This makes PPO more useful when comparing assets with different price ranges.
PPO Indicator Trading Signals
Traders can use the PPO Indicator in several ways to generate trading signals.
1. Signal Line Crossover Strategy
BUY Signal:
- PPO line crosses above the signal line
- Indicates increasing bullish momentum
- Entry: Buy position with stop-loss below recent swing low
SELL Signal:
- PPO line crosses below the signal line
- Indicates rising bearish momentum
- Entry: Sell position with stop-loss above recent swing high
2. Zero Line Crossover Strategy
BUY Signal:
- PPO crosses above zero line
- Indicates bullish Trend Strength
SELL Signal:
- PPO crosses below zero line
- Indicates bearish trend direction
3. Divergence Trading
The PPO Indicator is also effective for spotting divergence setups:
- Bullish divergence → price falls, PPO rises → potential buy
- Bearish divergence → price rises, PPO falls → potential sell
These signals often appear before major reversals.
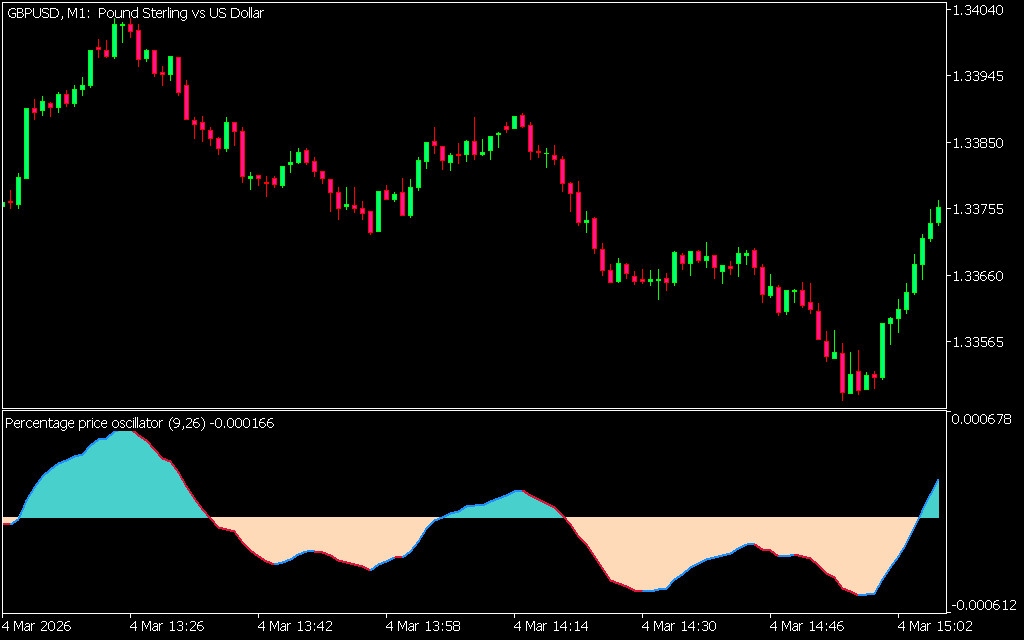
4. Momentum Strength Analysis
The distance of the PPO line from the zero line shows:
- Strong momentum when far from zero
- Weak momentum when close to zero
This helps traders gauge trend strength.
Who Should Use the PPO Indicator?
The PPO Indicator is suitable for:
- Beginner traders learning MACD-style tools
- Intermediate traders refining momentum strategies
- Advanced traders building automated systems
It works well on:
- Intraday charts
- Swing trading setups
- Daily, weekly, and monthly timeframes
Trading Tips
- Always combine PPO signals with Price Action confirmation
- Avoid trading every crossover in sideways markets
- Use higher timeframes for stronger signals
- Combine with support/resistance or trend indicators
Key Benefits of the PPO Indicator
- Measures trend momentum in percentage form
- Easy to use for MACD-based strategies
- Works across all markets and timeframes
- Helps identify trend reversals and continuation
- Supports divergence-based trading strategies
Conclusion
The PPO Indicator for MT5 is a versatile momentum tool that improves upon MACD by measuring price movement in percentage terms. It helps traders identify trends, momentum shifts, and divergence opportunities with greater flexibility.
However, like all momentum indicators, it should not be used alone. For best results, combine PPO signals with price action and other technical tools.
Best of all, the PPO Indicator is completely free to download, making it a valuable addition to any trading strategy.
2 Downloads
Published:
Apr 11, 2026 04:37 AM
Category: