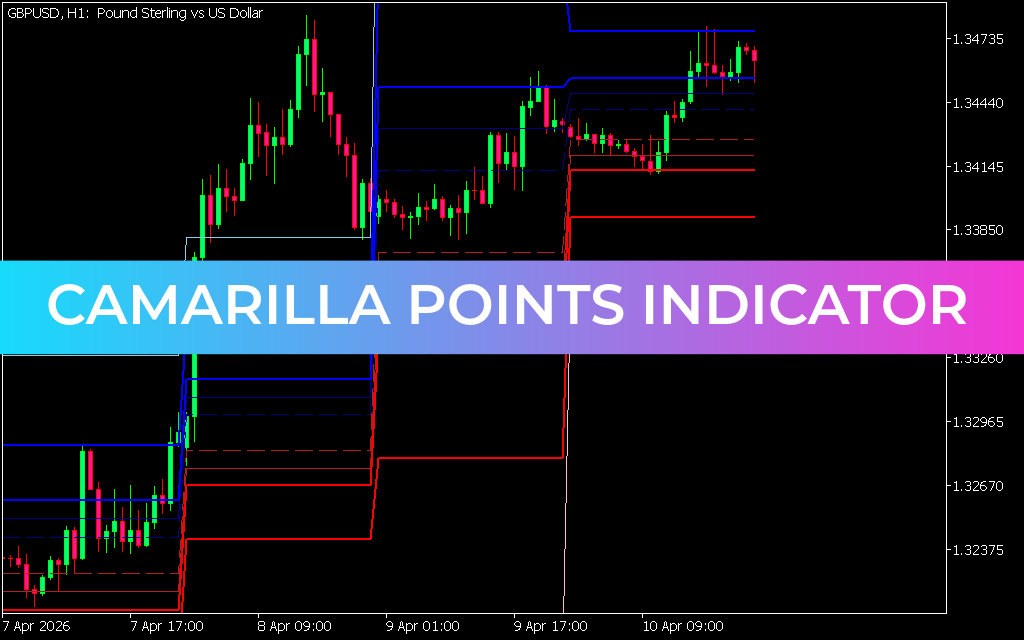
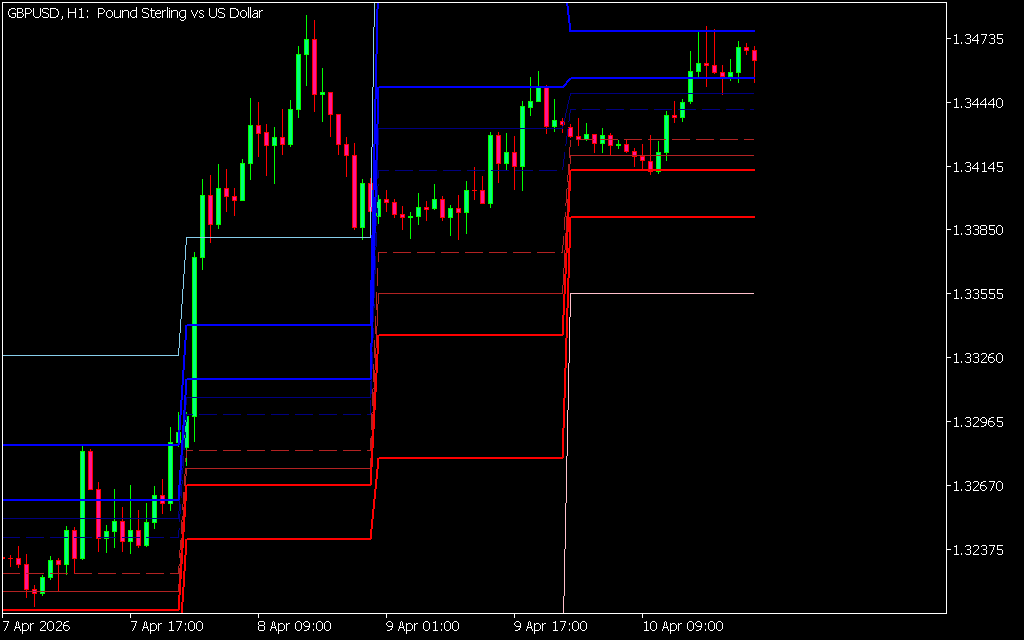
The Camarilla Points Indicator for MT5 is a powerful support and resistance tool used by traders to identify key intraday price levels. It is based on a mathematical formula that uses the previous day’s high, low, and close prices to generate multiple trading levels.
Developed from the original Camarilla Pivot methodology by Nick Scott, this indicator is widely used in forex and stock trading for precise entry and exit planning.
What is the Camarilla Points Indicator?
The Camarilla Points Indicator is a pivot-based trading tool that calculates multiple support and resistance levels using Fibonacci-based formulas.
It generates:
- 4 resistance levels (R1–R4)
- 4 support levels (S1–S4)
- Additional midpoint levels for trend analysis
In total, it plots up to 10 dynamic price levels on the chart.
How Does the Camarilla Points Indicator Work?
The indicator uses the previous trading session’s price data to project future support and resistance zones.
- Upper levels (Resistance) → Potential sell zones
- Lower levels (Support) → Potential buy zones
- Breakouts above/below extreme levels → Strong trend signals
If price breaks above or below key levels, it often signals strong momentum in that direction.
Key Features of Camarilla Points Indicator
- Based on previous day high, low, and close
- Generates multiple support and resistance levels
- Uses Fibonacci-based calculations
- Suitable for intraday trading strategies
- Works on forex, stocks, and indices
- Helps identify breakout and reversal zones
How to Trade with Camarilla Points Indicator
Traders use Camarilla levels to find high-probability entry and exit points.
BUY Signal (Long Entry)
A BUY setup occurs when:
- Price reaches lower support levels (S3–S4 zone)
- Bullish Price Action appears (rejection or reversal candles)
- Market shows upward momentum
This suggests a potential upward reversal or bounce.
SELL Signal (Short Entry)
A SELL setup occurs when:
- Price reaches upper resistance levels (R3–R4 zone)
- Bearish rejection appears
- Market shows weakening bullish momentum
This indicates a potential downward reversal.
Breakout Trading Strategy
The indicator also works well for breakout setups:
- Break above R4 → Strong bullish trend
- Break below S4 → Strong bearish trend
These breakouts often lead to high-volatility moves.
Trading Tips
- Use on H1, H4, and Daily charts for better accuracy
- Combine with RSI or MACD for confirmation
- Wait for price action signals (candlestick rejection)
- Avoid trading in choppy market conditions
Key Benefits of Camarilla Points Indicator
- Provides clear support and resistance zones
- Helps identify reversals and breakouts
- Works for intraday and swing trading
- Easy to use for beginners
- Improves trade timing and accuracy
Limitations
- Can produce false signals on lower timeframes
- Requires confirmation from price action
- Works best in trending or active markets
Conclusion
The Camarilla Points Indicator for MT5 is a highly effective tool for identifying key support and resistance levels using Fibonacci-based calculations. It helps traders spot reversal zones, breakout opportunities, and intraday trading setups with greater precision.
For best results, it should be combined with price action and other technical indicators.
Best of all, the Camarilla Points Indicator is completely free to download, making it a valuable addition to any trading strategy.
1 Download
Published:
Apr 11, 2026 05:49 AM
Category: