Free
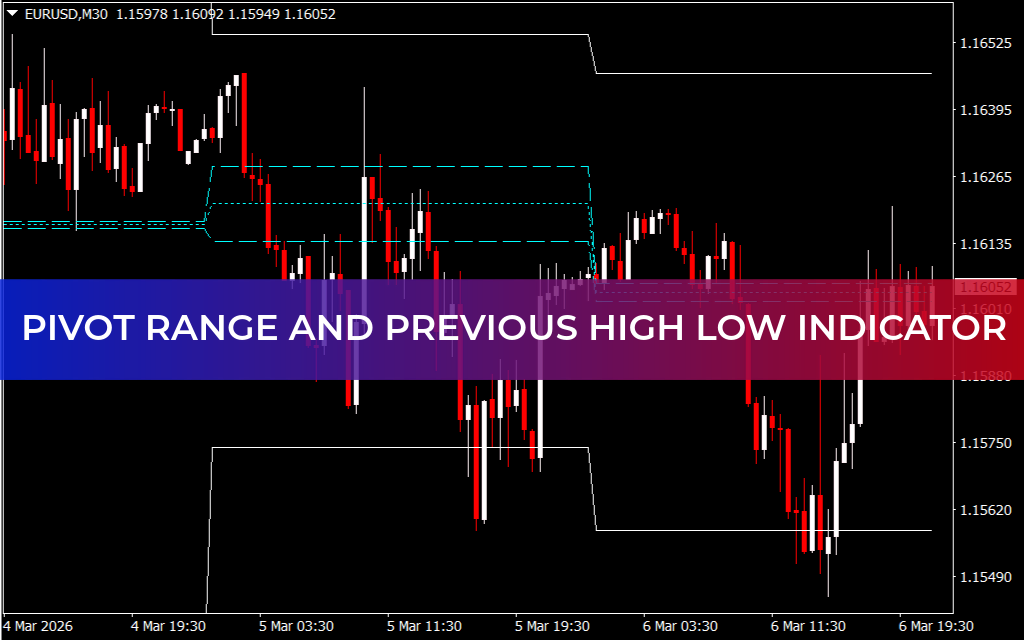
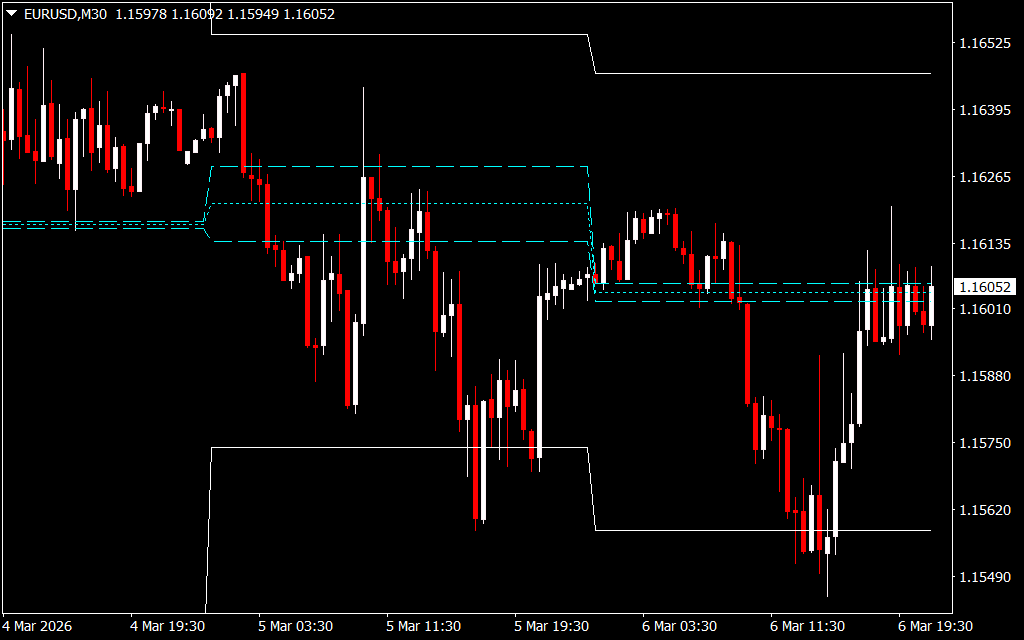
The Pivot Range and Previous High-Low Indicator for MetaTrader 4 is a versatile trading tool that plots dynamic price channels and key support/resistance zones. It helps traders make better decisions by identifying intraday pivot points and market extremes across all trading sessions.
Key Features
- Dynamic Pivot Levels
- The indicator shows the current pivot level, which acts as an intraday price breakout zone.
- Price above the pivot → bullish trend → consider buy opportunities
- Price below the pivot → bearish trend → consider sell opportunities
- High-Low Channel
- Uses current highs, new highs, and new lows to calculate market breadth.
- Smooths results using a 10-day SMA to highlight overall strength or weakness.
- Guides traders through maximum pullback areas, signaling potential overbought/oversold conditions.
- Trading Support/Resistance Zones
- Upper and lower channel bands indicate potential reversal zones.
- Can be applied on all timeframes for Scalping, intraday, or swing strategies.
- Adaptable & Easy to Use
- Works for forex, stocks, and indices
- Helps traders time entries and exits more effectively using pivot levels
How to Trade Using Pivot Range and Previous High-Low Indicator
- Breakout Strategy
- Wait for price to cross the pivot line:
- Above pivot: Bullish trend → look for long trades
- Below pivot: Bearish trend → look for short trades
- Breakouts above/below the channel confirm market momentum, though entries may be slightly delayed.
- Wait for price to cross the pivot line:
- Pullback Strategy
- Enter trades near support/resistance bands after the trend is confirmed:
- Long trades: Place stop-loss (SL) below channel-low
- Short trades: Place SL above channel-high
- Enter trades near support/resistance bands after the trend is confirmed:
- Trend Confirmation
- Use pivot levels in combination with Price Action or other indicators to confirm entry signals.
- Monitor highs/lows to gauge market strength or weakness before committing.
Example
- On a 4-hour EURUSD chart:
- Price initially in an uptrend crossed above the pivot → bullish signal
- Later, price dropped below pivot range → trend reversed → bearish breakout confirmed
- Traders can enter short after pullback near the upper channel band
Benefits
- Dynamic multi-timeframe support – works on M1 to monthly charts
- Clear pivot and channel visualization – simplifies decision-making
- Versatile – can be used for trend-following, breakout, or pullback strategies
- Compatible with other tools – improves trade accuracy when combined with oscillators or price action
Conclusion
The Pivot Range and Previous High-Low Indicator for MT4 is a multi-functional tool for identifying support/resistance zones, pivot points, and trend reversals. By combining pivot analysis with dynamic price channels, traders can enhance their entry/exit decisions and refine their strategies for intraday, swing, or trend trading. It’s compatible with existing trading setups and helps to improve overall accuracy.
FAQ
Current pivot acts as intraday price breakout zone. Price above pivot = bullish, consider buy. Price below pivot = bearish, consider sell.
Uses current highs, new highs, new lows for market breadth. Smooths with 10-day SMA. Highlights overall strength or weakness. Guides through maximum pullback areas.
Potential reversal zones. Can be applied on all timeframes. Scalping, intraday, or swing strategies.
Forex, stocks, indices traders. Better decisions using pivot levels. MT4.
Identify intraday pivot points. Market extremes across all sessions. Time entries and exits.
Published:
Mar 06, 2026 16:48 PM
Category:
Share: