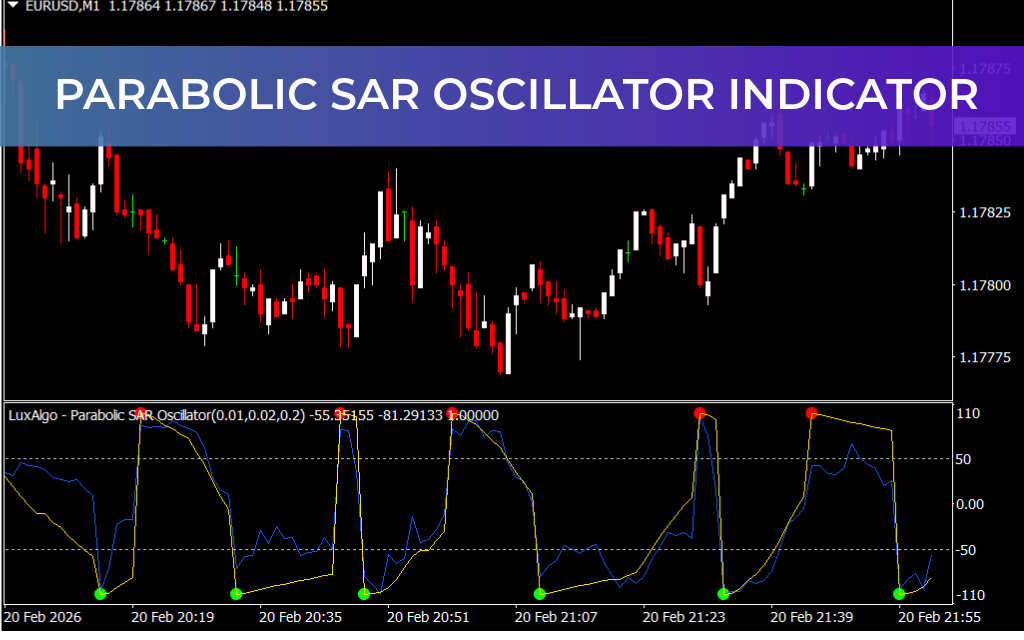
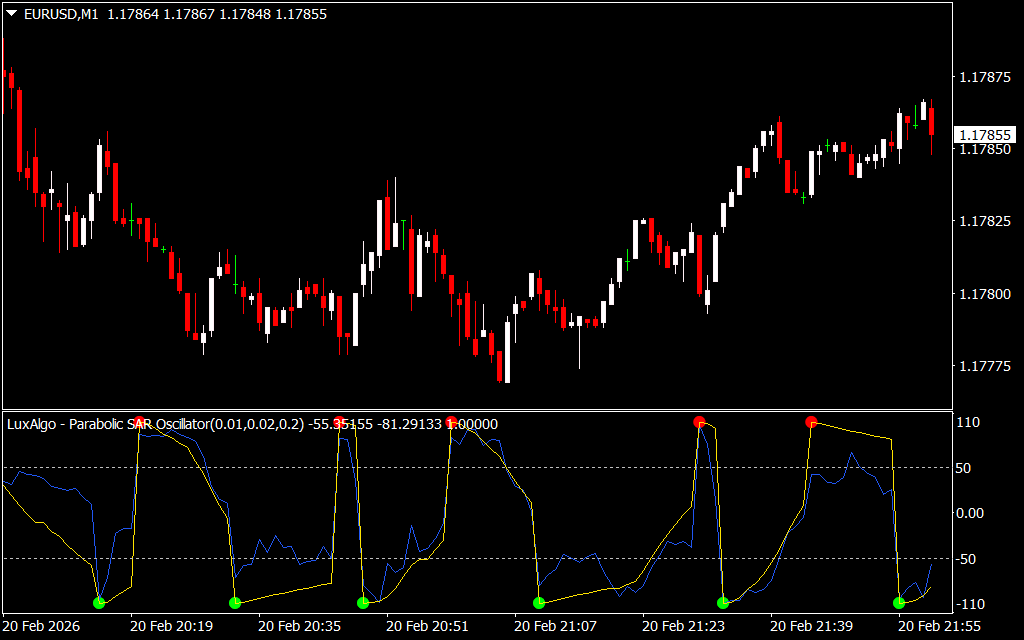
The Parabolic SAR Oscillator by LuxAlgo transforms the classic Parabolic SAR into an oscillator format, offering traders a smoother and more precise method to track trends, reversals, and momentum shifts. Built for the MetaTrader 4 environment, this indicator provides clear overbought and oversold zones, making it particularly effective for timing entries and exits within trending markets.
By converting SAR dots into a continuous oscillating curve, it gives traders a visual edge for early detection of trend exhaustion, helping refine momentum-based strategies.
How the Parabolic SAR Oscillator Works
The oscillator generates actionable signals through its dynamic curve:
- Green Circles (Bottom of Oscillator) – Indicate oversold conditions and potential bullish reversals
- Red Circles (Top of Oscillator) – Signal overbought conditions and possible bearish shifts
- Rising Curve from Lower Boundary – Suggests building bullish momentum
- Descending Curve from Upper Boundary – Indicates emerging bearish pressure
These visual cues are most effective when combined with price structure, volume indicators, or other confluence tools, allowing traders to anticipate market shifts before traditional SAR dots would signal a flip.
Trading Applications
The Parabolic SAR Oscillator supports a variety of strategies:
- Trend Reversals – Identify exhaustion points in trending markets
- Entry Timing – Capture early moves with smoother oscillation signals
- Exit Planning – Spot potential trend fatigue for improved risk management
- Confluence Trading – Combine with support/resistance, volume, or other momentum tools for higher probability setups
Its oscillator format reduces noise and provides clean, proactive signals for modern trading approaches.
Key Benefits
1. Smooth Oscillator Format
Eliminates the choppiness of traditional SAR dots for easier interpretation.
2. Overbought/Oversold Clarity
Green and red circles highlight potential reversal zones with precision.
3. Early Reversal Detection
Signals emerging momentum shifts before conventional SAR flips occur.
4. Versatile Strategy Integration
Works with trending, reversal, and confluence-based trading setups.
5. Visual Simplicity
Clean, intuitive design ensures chart readability and rapid decision-making.
Conclusion
The Parabolic SAR Oscillator by LuxAlgo is a modern, enhanced adaptation of the classic SAR indicator. By converting trend-following dots into a smooth oscillator with overbought and oversold cues, it provides traders with precise, actionable signals for entries, exits, and reversals. Ideal for both novice and advanced traders, it strengthens momentum-based strategies while maintaining clear visual insight on MetaTrader 4.
FAQ
6 Downloads
Published:
Feb 22, 2026 17:34 PM
Category: