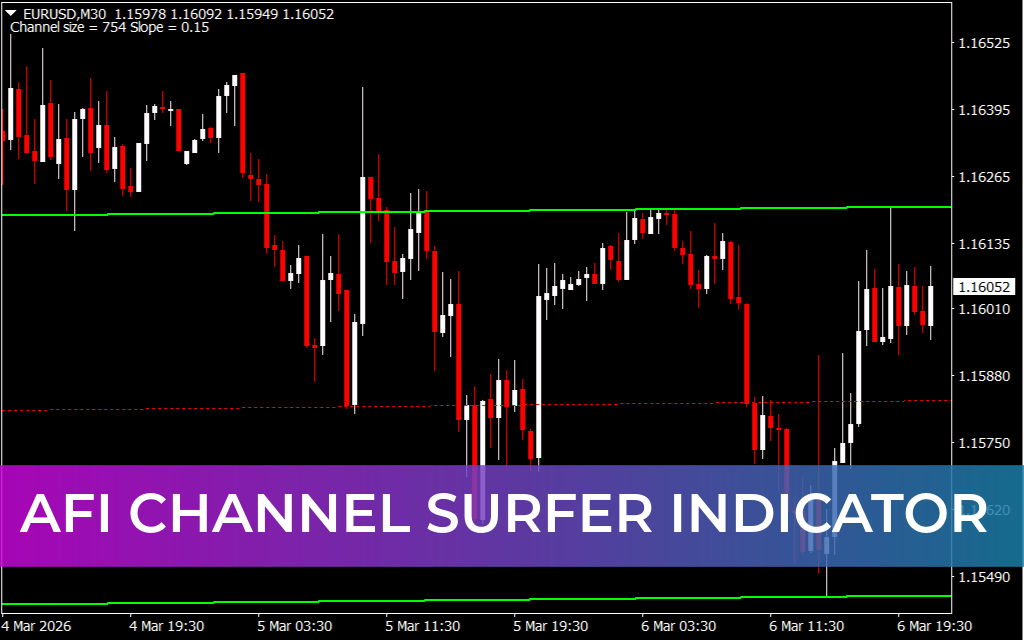
The AFI Channel Surfer Indicator for MetaTrader 4 (MT4) is an automatic price channel tool that helps traders identify trendline-based Support And Resistance levels on the chart. By drawing parallel channel lines around price movements, the indicator highlights potential trend direction, breakout zones, and reversal areas.
Price channels are commonly used in technical analysis to determine where price is likely to react within a trend. The AFI Channel Surfer indicator simplifies this process by automatically detecting and plotting these channels, making it easier for traders to identify trading opportunities.
Because of its clear channel visualization and trend analysis capabilities, this indicator is suitable for both forex and stock traders.

What Is a Price Channel?
A price channel is a chart pattern formed by two parallel trend lines that contain the price movement of an asset.
These channels can appear in different forms:
- Ascending Channel – Indicates a bullish trend
- Descending Channel – Indicates a bearish trend
- Horizontal Channel – Indicates a ranging or sideways market
The upper trendline typically acts as resistance, while the lower trendline acts as support.
When price breaks out of these boundaries, it often signals a new trend or strong momentum move.
Key Features of the AFI Channel Surfer Indicator
The AFI Channel Surfer indicator provides several useful features for technical traders:
- Automatically detects and draws price channels
- Identifies dynamic support and resistance levels
- Helps locate trend reversals and breakout opportunities
- Works across multiple timeframes (MTF)
- Useful for Price Action Trading strategies
These features make the indicator a practical tool for traders who rely on trendline analysis and Market Structure.
How to Trade With the AFI Channel Surfer Indicator
The AFI Channel Surfer indicator helps traders identify potential buy and sell opportunities within a price channel.
Buy Trade Setup
- Price approaches the lower channel boundary (support).
- The market shows bullish Price Action.
- Price rebounds from the support level.
- Traders may enter a buy trade.
In this scenario, traders often set the profit target near the upper channel resistance.
Sell Trade Setup
- Price moves toward the upper channel boundary (resistance).
- Price shows bearish rejection or reversal patterns.
- Traders may open a sell trade.
The lower channel line can act as a potential target level.
Trading Channel Breakouts
The AFI Channel Surfer indicator is also useful for identifying breakout opportunities.
A breakout occurs when:
- Price breaks above the upper channel line and continues upward.
- Price breaks below the lower channel line and continues downward.
When a breakout happens and price remains outside the channel, it often signals strong market momentum and the beginning of a new trend.
Using Channels for Price Targets
Another advantage of price channels is their ability to help traders estimate profit targets.
Example:
- If a trader buys near channel support, the logical profit target could be channel resistance.
- If a trader sells near channel resistance, the potential target could be channel support.
This structure helps traders plan risk-to-reward ratios more effectively.
Conclusion
The AFI Channel Surfer Indicator for MT4 is a powerful technical tool that automatically identifies price channels and trendline support/resistance levels. It helps traders detect trend reversals, breakout opportunities, and potential profit targets using clear channel structures.
Because of its automated channel detection and compatibility with price action trading strategies, the indicator is especially useful for day traders and intraday traders. Best of all, it is free to download and easy to install on MetaTrader 4.
FAQ
Published:
Mar 08, 2026 07:10 AM
Category: