The Murrey Math Levels Indicator for MT4 is a powerful price level analysis tool designed to help traders identify key Support And Resistance zones in the market. These levels play a crucial role in technical analysis because they often determine where price may reverse, consolidate, or break out.
Manually identifying reliable support and resistance levels can be challenging, especially for new traders. The Murrey Math Levels Indicator simplifies this process by automatically plotting important price levels based on recent market swings, allowing traders to quickly recognize potential trading opportunities.
This indicator is widely used by forex and stock traders who rely on Price Action and level-based trading strategies.
What is the Murrey Math Levels Indicator?
The Murrey Math Levels Indicator is based on the “Squaring of Price” theory, which divides price movement into specific mathematical levels. These levels represent potential areas where the market may react strongly.
Once applied to a chart in MetaTrader 4, the indicator draws horizontal lines across the chart, highlighting possible support and resistance zones.
These levels help traders identify:
- Potential price retracement areas
- Trend continuation zones
- Possible breakout levels
- Market reversal points
Because the indicator works across multiple timeframes (MTF), traders can analyze both short-term and long-term market movements effectively.
Murrey Math Levels Explained
The indicator plots eight key support and resistance levels on the chart.
Weak Support and Resistance Levels (Lines 1–4)
Lines 1 to 4 represent weaker support and resistance zones.
At these levels, price tends to move through the level more easily, often resulting in breakouts rather than reversals.
Traders frequently observe the market building momentum around these areas before making a stronger directional move.
Strong Support and Resistance Levels (Lines 5–8)
Lines 5 to 8 represent stronger support and resistance zones.
Price is more likely to reverse or consolidate around these levels because they represent stronger market equilibrium points.
These areas often act as turning points in the market, making them valuable for identifying potential buy or sell opportunities.
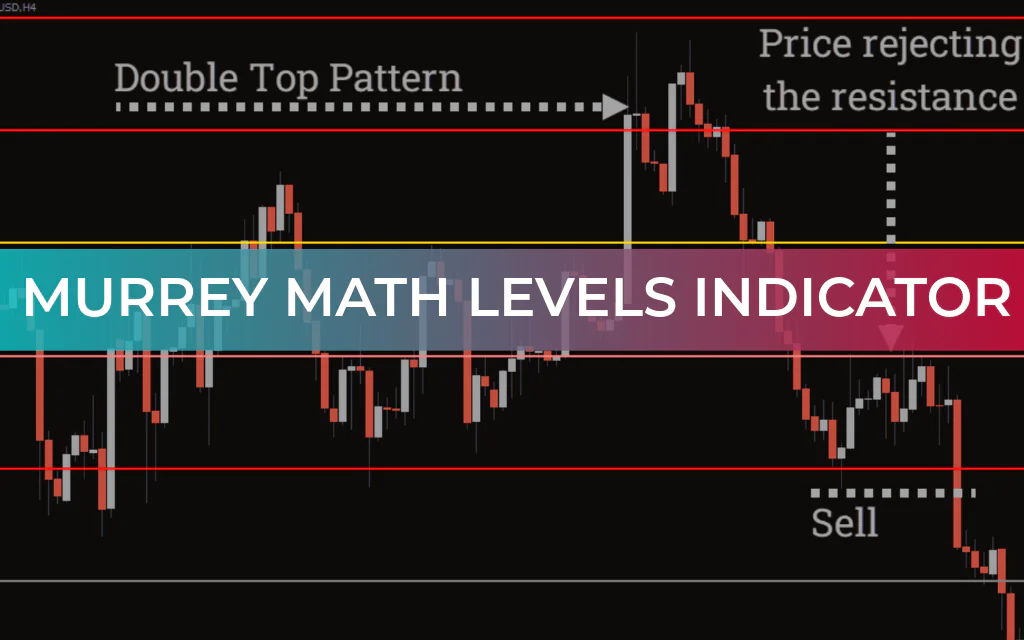
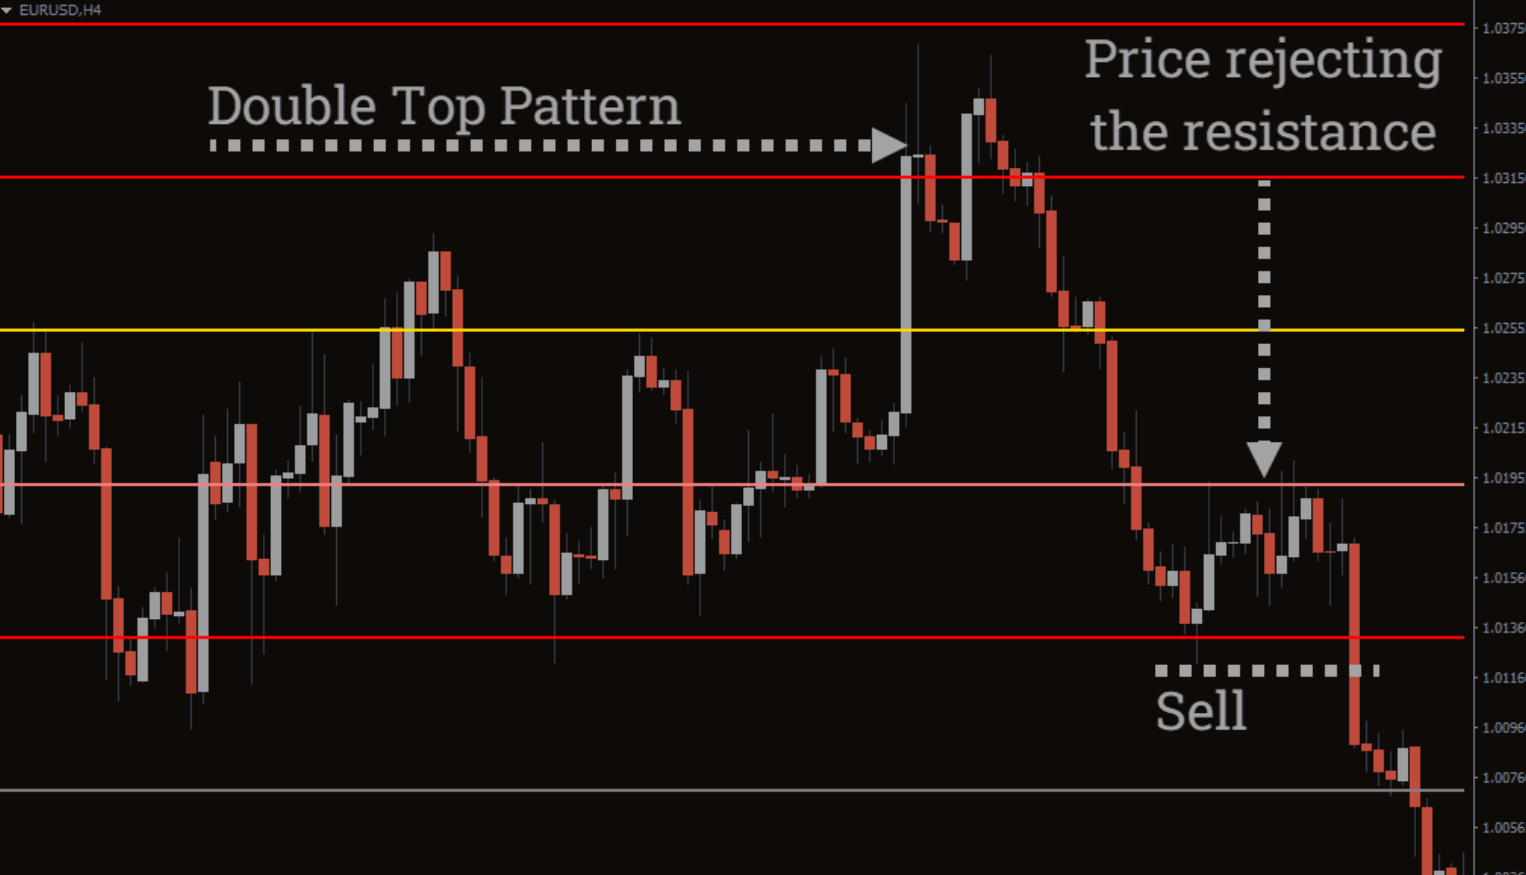
Example of a Sell Setup
Consider a GBP/USD chart where price approaches the 8th Murrey Math Level.
If the market rejects this level twice, it can form a double top pattern, signaling strong resistance. When the price later breaks below the 7th level, it confirms a bearish breakout, creating a potential short trading opportunity.
This type of setup shows how Murrey Math Levels can help traders confirm price patterns and breakout signals.
Trend-Following Example
Murrey Math Levels can also help identify trend continuation trades.
For example, in a downtrend, price may consolidate between the 4th and 5th levels. When the market finally breaks below this consolidation range, it indicates that bearish momentum is continuing, presenting a possible opportunity to enter a short position.
This makes the indicator useful for both breakout trading and trend-following strategies.
Why Traders Use Murrey Math Levels
The Murrey Math Levels Indicator offers several advantages for traders:
- Automatically identifies important support and resistance levels
- Helps detect breakouts and reversal points
- Works well with price action strategies
- Supports multi-timeframe analysis
- Useful for forex, stocks, and other financial markets
By highlighting potential turning points in the market, the indicator helps traders make more informed entry and exit decisions.
Trading Tips When Using Murrey Math Levels
To get the best results with this indicator, traders should:
- Observe price behavior around Murrey Math levels
- Combine the indicator with candlestick patterns or trend analysis
- Watch for breakouts or rejection signals at key levels
- Use levels to determine stop-loss and take-profit zones
Monitoring how price reacts to these levels is essential for identifying high-probability trading setups.
Conclusion
The Murrey Math Levels Indicator for MT4 is an excellent tool for traders who rely on price action and support-resistance analysis. By automatically plotting multiple market levels, it helps traders identify potential entry points, stop-loss areas, and breakout opportunities.
Whether you are a day trader, swing trader, or price action trader, the Murrey Math Levels Indicator can become a valuable addition to your MT4 trading toolkit.
Download Murrey Math Levels Indicator for MT4 for Free Now!
FAQ
1 Download
Published:
Mar 09, 2026 08:11 AM
Category: