The Aroon Up And Down Indicator for MT4 is a powerful tool for measuring trend direction and strength. By calculating the time between market highs and lows, it provides traders with valuable insight into whether the market is trending or showing potential reversals. This makes it ideal for spotting early trend changes and timing trade entries and exits effectively.
Key Features of the Aroon Up And Down Indicator
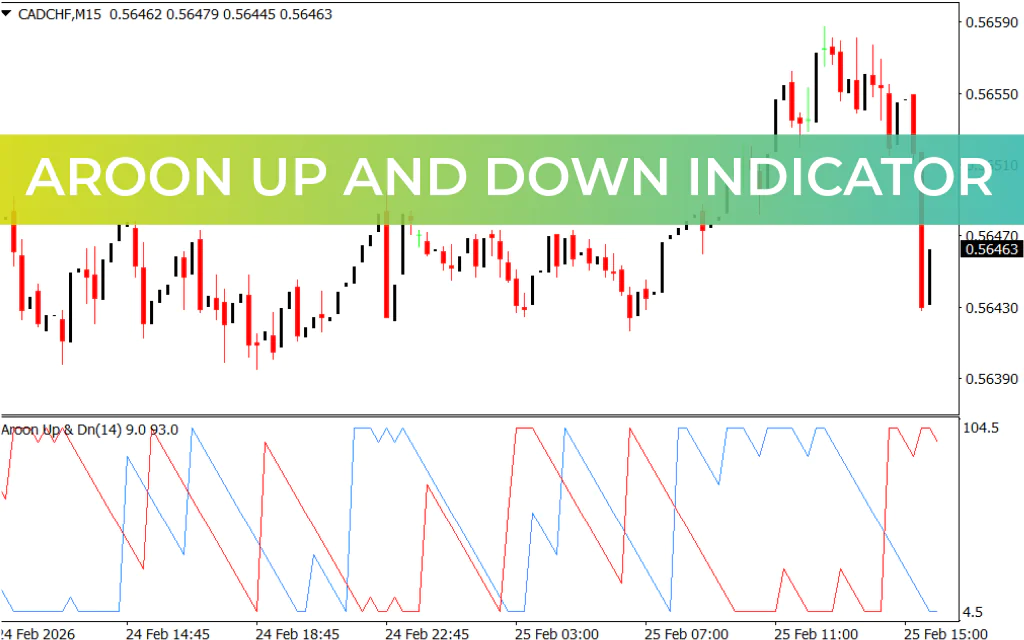
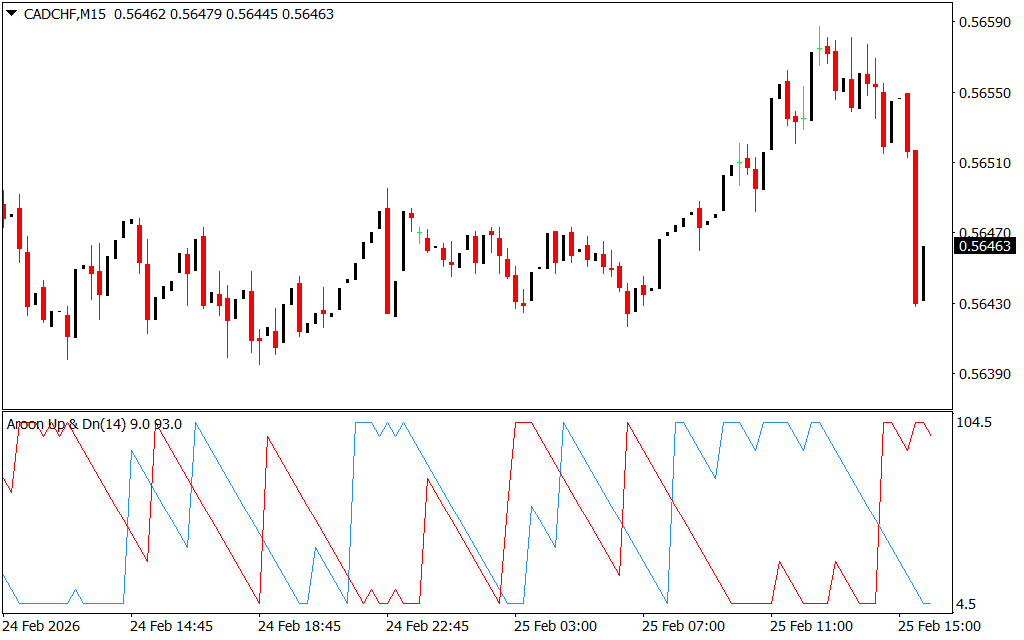
- Dual Oscillating Lines: Aroon Up (blue) signals upward trends, and Aroon Down (red) signals downward trends.
- Trend Strength Measurement: Values near 100 indicate strong bullish or bearish trends.
- Crossover Signals: Crosses between the blue and red lines highlight potential bullish or bearish shifts.
- Multi-Time Frame Compatibility: Suitable for short-term and long-term trading strategies.
How the Aroon Up And Down Indicator Supports Trading
The Aroon Up And Down Indicator provides clear signals for trend-following and reversal strategies:
- Buy Signals: Blue line (Aroon Up) crosses above red line (Aroon Down), indicating increasing bullish momentum.
- Sell Signals: Red line crosses above blue line, suggesting growing bearish pressure.
- Trend Confirmation: Combining the indicator with other technical tools can improve trade accuracy and reduce false signals.
Traders can use the Aroon Up And Down indicator to confirm trend strength, anticipate reversals, and make more informed trading decisions across multiple time frames.
Why Traders Use the Aroon Up And Down Indicator
For those seeking to monitor market trends and identify potential reversals, the Aroon Up And Down Indicator for MT4 is an essential tool. Its clear visual signals, versatile applications, and adaptability across time frames make it suitable for traders of all experience levels.
In summary, the Aroon Up And Down Indicator enhances trend analysis, provides reliable entry and exit signals, and helps traders capitalize on market momentum with confidence.
FAQ
1 Download
Published:
Feb 25, 2026 10:09 AM
Category: