The Murrey Math Indicator for MT5 is a powerful price level analysis tool that helps traders identify key support and resistance zones with precision. It is designed to simplify technical analysis by automatically plotting important price levels based on recent market behavior.
For traders who struggle to manually identify accurate entry and exit points, the Murrey Math Indicator offers a structured and reliable solution.
What is the Murrey Math Indicator?
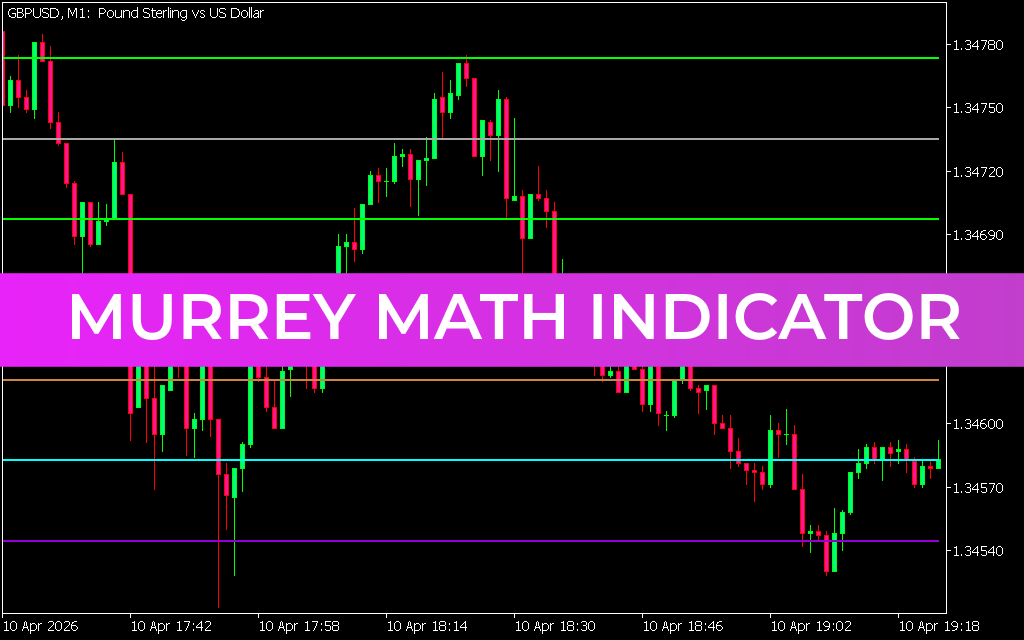
The Murrey Math Indicator is based on the concept of price “squaring,” which divides Price Action into structured levels. It automatically draws horizontal lines on the chart to highlight potential support and resistance zones.
These levels help traders:
- Identify trend reversals
- Spot breakout opportunities
- Anticipate price retracements
- Improve entry and exit timing
Why Price Level Analysis Matters
Price level analysis is essential in both forex and stock trading because it allows traders to:
- Determine precise buy and sell zones
- Set accurate stop-loss and take-profit levels
- Understand Market Structure and behavior
However, manually identifying these levels can be difficult—especially for beginners. The Murrey Math Indicator simplifies this process by doing it automatically.
How Murrey Math Levels Work
The indicator plots eight key support and resistance levels on the chart:
Weak Levels (Lines 1–4)
- Represent weaker support/resistance zones
- Price is more likely to break through these levels
- Often used to identify potential breakout setups
Strong Levels (Lines 5–8)
- Represent stronger support/resistance zones
- Price is more likely to reverse at these levels
- Ideal for spotting trend reversals and swing trades
How to Trade Using the Murrey Math Indicator
The Murrey Math Indicator can be used for both breakout and trend-following strategies.
1. Breakout Trading Strategy
- Watch price behavior near weak levels (Lines 1–4)
- Enter a trade when price breaks through a level with momentum
- Confirm with price action (e.g., strong candles, volume)
2. Reversal Trading Strategy
- Focus on strong levels (Lines 5–8)
- Look for reversal patterns such as double tops/bottoms
- Enter trades after confirmation signals
Example:
In a GBP/USD chart scenario:
- Price rejected the 8th level twice, forming a double top pattern
- A break below the 7th level confirmed a bearish breakout
- This created a high-probability sell opportunity
3. Trend Continuation Strategy
- Identify the overall trend direction
- Wait for price consolidation between levels
- Enter trades when price breaks in the direction of the trend
Key Benefits of the Murrey Math Indicator
- Automatically plots accurate support and resistance levels
- Works effectively on multiple timeframes (MTF)
- Suitable for forex, stocks, and indices
- Helps identify entry, exit, and stop-loss levels
- Supports both breakout and reversal strategies
Why Traders Use Murrey Math Levels
Murrey Math levels act as dynamic decision zones where price often:
- Reverses direction
- Consolidates
- Breaks out with momentum
By observing price behavior around these levels, traders can make more informed and confident trading decisions.
Conclusion
The Murrey Math Indicator for MT5 is a reliable and efficient tool for traders who rely on price action and support/resistance analysis. Its structured levels make it easier to identify high-probability trade setups, manage risk, and improve overall trading performance.
Best of all, it is free to download, making it an excellent choice for traders at any level.
Published:
Apr 11, 2026 03:57 AM
Category: