The Balance of Power (BOP) Indicator for MetaTrader (MT4/MT5) is a powerful technical analysis tool used to measure the strength of buyers (bulls) and sellers (bears) in the market. It helps traders understand who is in control and whether price is likely to continue trending or reverse.
By analyzing buying and selling pressure, the Balance of Power Indicator enables traders to make more accurate and confident trading decisions.
What is the Balance of Power Indicator?
The Balance of Power Indicator evaluates market sentiment by comparing price movements between the open, high, low, and close.
It is calculated using a formula derived from:
- Close price
- Open price
- High price
- Low price
The indicator typically includes a 14-period moving average, which smooths the data and makes it easier to interpret.
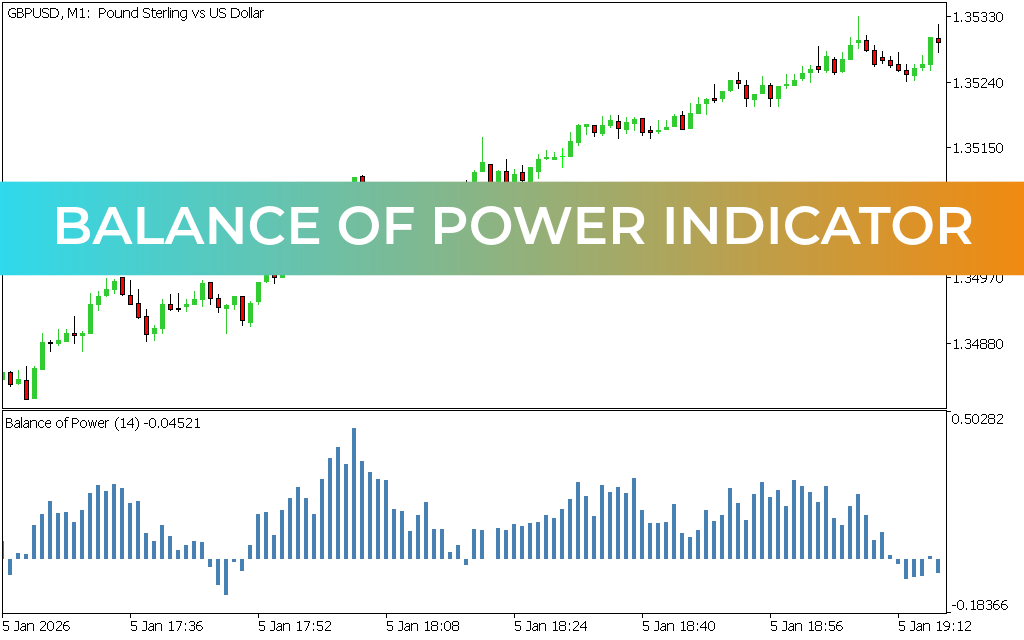
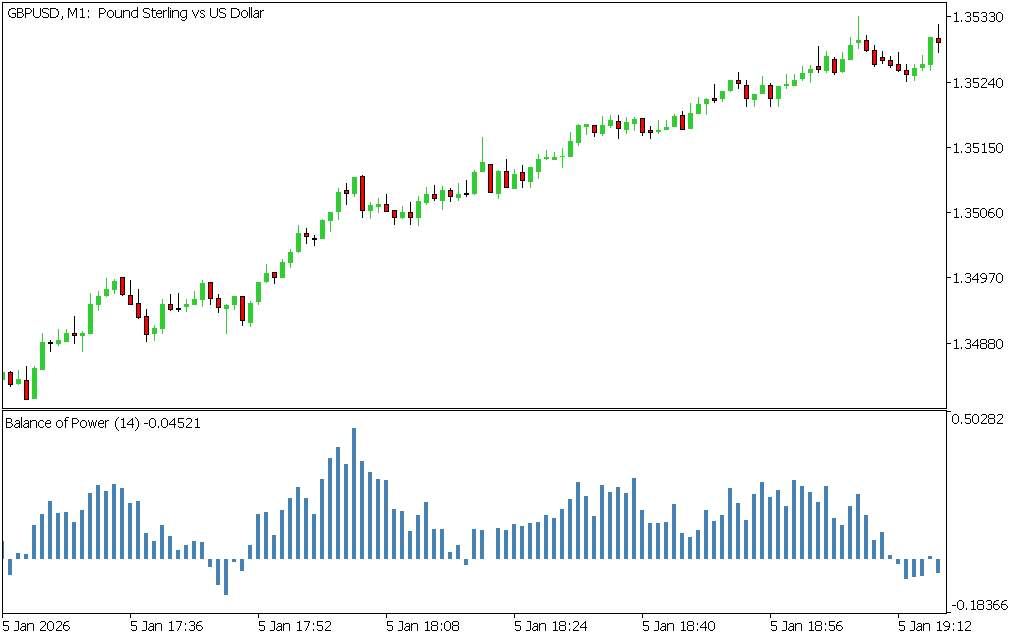
How Does the Balance of Power Indicator Work?
The BOP Indicator is displayed as a histogram that fluctuates around a central zero line:
- Above Zero Line → Strong bullish pressure (buyers in control)
- Below Zero Line → Strong bearish pressure (sellers in control)
Visual Signals:
- Green/Lime bars above zero → Bullish momentum
- Red bars below zero → Bearish momentum
The zero line acts as a key level for identifying overall market direction.
Key Features of the BOP Indicator
- Identifies buying vs selling strength
- Detects trend continuation and reversals
- Helps find overbought and oversold conditions
- Easy to interpret with clear visual signals
- Works across multiple trading styles
How to Trade with the Balance of Power Indicator
For best results, combine the BOP Indicator with Price Action or candlestick patterns.
BUY Signal (Long Entry)
A valid BUY setup occurs when:
- Histogram bars move above the zero line
- Bullish momentum is increasing
- A bullish candlestick pattern appears (e.g., bullish engulfing)
This indicates strong buyer dominance and potential upward movement.
SELL Signal (Short Entry)
A valid SELL setup occurs when:
- Histogram bars move below the zero line
- Bearish momentum is increasing
- A bearish candlestick pattern forms (e.g., bearish engulfing)
This signals strong selling pressure and potential downward movement.
Trading Example
On a GBP/USD H1 chart:
- A BUY signal is confirmed when bullish histogram bars appear above zero along with a bullish engulfing pattern
- A SELL signal is confirmed when bearish histogram bars fall below zero and align with a bearish engulfing pattern
This combination improves the probability of successful trades.
Why Use the Balance of Power Indicator?
Traders prefer the BOP Indicator because it:
- Clearly shows who controls the market
- Helps confirm trend direction
- Enhances entry and exit timing
- Works well for scalping, intraday, and swing trading
Conclusion
The Balance of Power Indicator is a reliable and effective tool for analyzing market strength and momentum. By understanding the balance between buyers and sellers, traders can identify high-probability trading opportunities and improve their overall strategy.
When combined with price action, it becomes even more powerful for spotting accurate entries and exits.
Best of all, the Balance of Power Indicator is completely free to download, making it a valuable addition to any trader’s toolkit.
Published:
Apr 11, 2026 04:11 AM
Category: