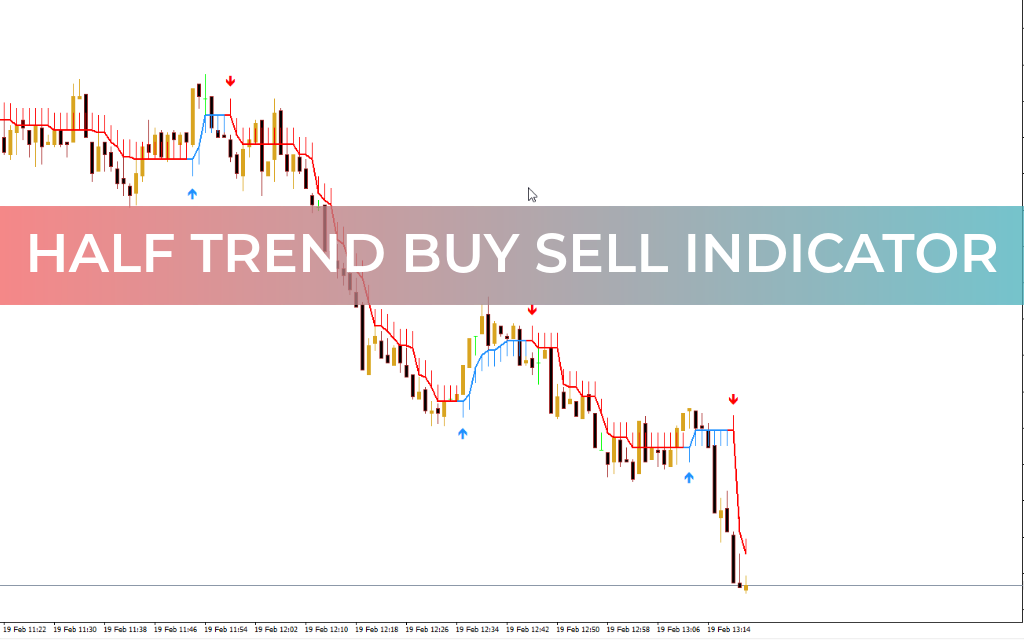
The Half Trend Buy Sell MT4 Indicator is a trend-following tool designed for MetaTrader 4 that delivers accurate BUY and SELL signals with arrows and provides clear exit signals. Being a non-repainting indicator, it ensures live signals are reliable for both intraday and swing traders.
This indicator leverages moving averages to calculate trend direction and strength, making it easy for traders to identify market conditions at a glance.
Key Features
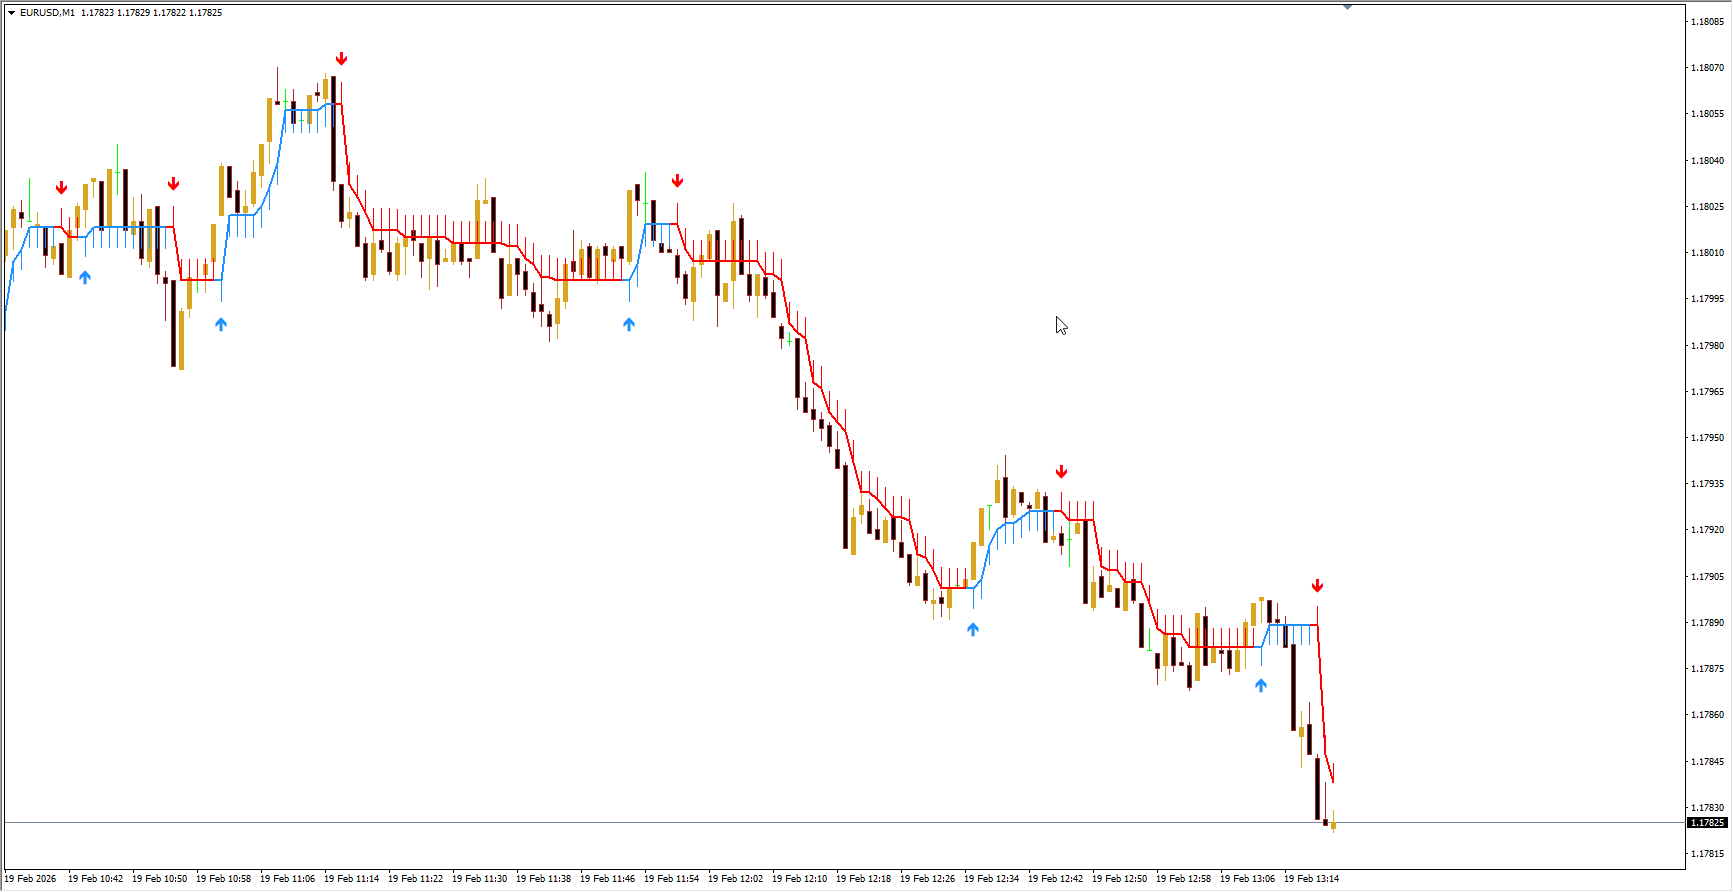
Live Arrow Signals: Blue arrows for BUY, red arrows for SELL.
Trend Strength Indication:
Steep upward slope and blue color → strong uptrend.
Steep downward slope and red color → strong downtrend.
Flat line → absence of a clear trend.
Non-Repainting: Ensures signals remain consistent after appearing.
Versatile: Works on all timeframes for intraday and swing trading.
Simple Interpretation: Easy visual signals for entry, exit, and trend strength.
How to Trade with Half Trend Buy Sell MT4 Indicator
BUY Signal Criteria:
Price is above the indicator.
Indicator color is blue.
Blue arrow appears below the indicator.
SELL Signal Criteria:
Price is below the indicator.
Indicator color is red.
Red arrow appears above the indicator.
Managing the Trade:
Place stop-loss below the previous swing low for BUY positions.
Place stop-loss above the previous swing high for SELL positions.
Exit when an opposite Arrow Signal appears to ride the trend effectively.
Conclusion
The Half Trend Buy Sell MT4 Indicator is an essential tool for trend trading. It combines accurate entry and exit signals with trend strength visualization. Its non-repainting nature makes it a highly reliable indicator for new and experienced forex traders alike. This free MT4 indicator simplifies trend trading while maintaining high accuracy.
FAQ
2 Downloads
Published:
Feb 19, 2026 09:52 AM
Category: