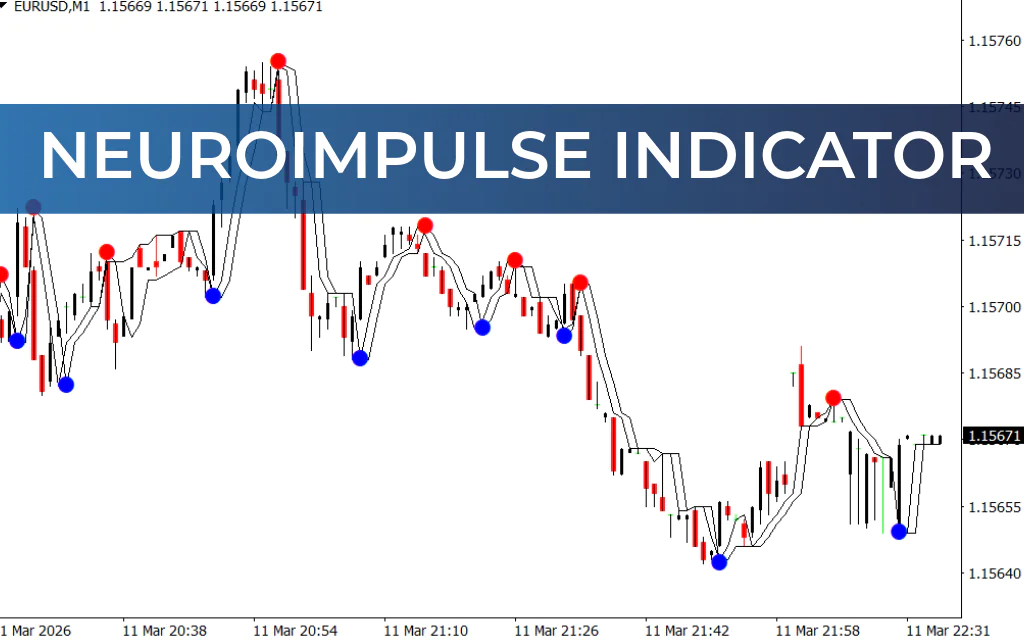
The NeuroImpulse Indicator for MT4 is a unique technical analysis tool that helps traders identify market trends, support, and resistance levels. The indicator is displayed using two lines that form a cloud-like strip, similar in appearance to the Ichimoku Kinko Hyo indicator.
These two lines follow the price movement of a currency pair or trading instrument, creating a dynamic zone that traders can use to evaluate the direction of the market.
- The inner line reflects the current price direction.
- The outer line acts as a dynamic Support And Resistance level.
Because of this structure, traders can quickly determine whether the market is bullish or bearish by observing the position of price relative to the indicator strip.
How the NeuroImpulse Indicator Works
The NeuroImpulse indicator forms a band or strip around Price Action, allowing traders to visually assess the strength of a trend.
When price interacts with this strip, it can signal either trend continuation or potential reversals.
Key characteristics of the indicator include:
- Cloud-style visual trend zone
- Dynamic support and resistance levels
- Clear trend direction signals
- Works on all timeframes
The indicator can be applied to forex, stocks, commodities, indices, and cryptocurrencies. Although effective on its own, it works best when combined with other indicators such as moving averages.
Key Features of the NeuroImpulse Indicator
The NeuroImpulse Indicator offers several advantages:
- Cloud-style trend visualization similar to Ichimoku
- Dynamic support and resistance levels
- Suitable for any trading instrument
- Works on multiple timeframes
- Helps identify trend continuation and reversals
- Easy to combine with other technical indicators
Because of its clear visual structure, both beginner and experienced traders can use the indicator to analyze market direction.
NeuroImpulse Indicator Trading Signals
The NeuroImpulse Indicator generates trading signals based on the position of price relative to the indicator strip.
Buy Signal
A BUY signal occurs when the price action moves above the indicator strip.
This suggests that bullish momentum is dominating the market.
Trading steps:
- Wait for the price to move above the two indicator lines.
- Confirm the signal with a 21-period Exponential Moving Average (EMA) crossing above the indicator strip.
- Enter a BUY (long) position.
- Hold the trade while the price remains above the indicator.
Sell Signal
A SELL signal occurs when the price action moves below the indicator strip.
This indicates increasing bearish pressure in the market.
Trading steps:
- Wait for the price to fall below the indicator lines.
- Confirm the signal with the 21-period EMA crossing below the indicator strip.
- Enter a SELL (short) position.
- Exit the trade if the price moves back above the indicator.
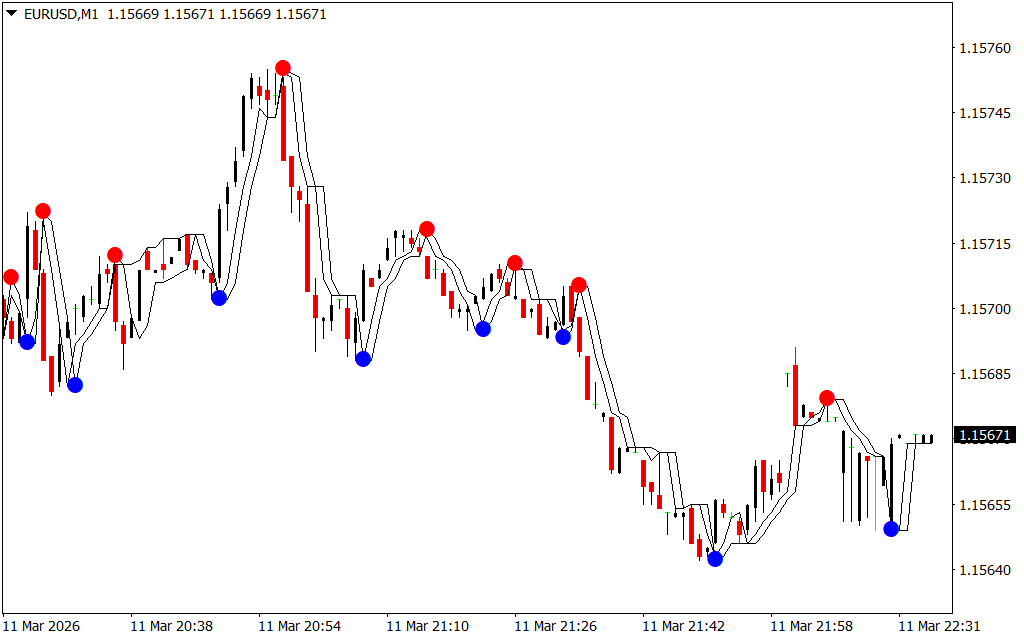
Trading Example
In a typical chart example, the NeuroImpulse Indicator clearly shows trend direction. When the indicator strip remains below the price, the market is generally in a strong uptrend.
Conversely, when the price moves below the indicator strip, it signals a downtrend, indicating that sellers are controlling the market.
This simple visual relationship between price and the indicator strip makes it easier for traders to quickly identify trading opportunities.
Conclusion
The NeuroImpulse Indicator for MT4 is a practical tool for identifying trend direction and dynamic support and resistance levels. Its cloud-like structure provides a clear visual representation of market conditions, making it easier for traders to analyze price movements.
For the best results, traders should combine the indicator with moving averages or other technical analysis tools to confirm signals and improve trading accuracy.
FAQ
1 Download
Published:
Mar 11, 2026 17:49 PM
Category: