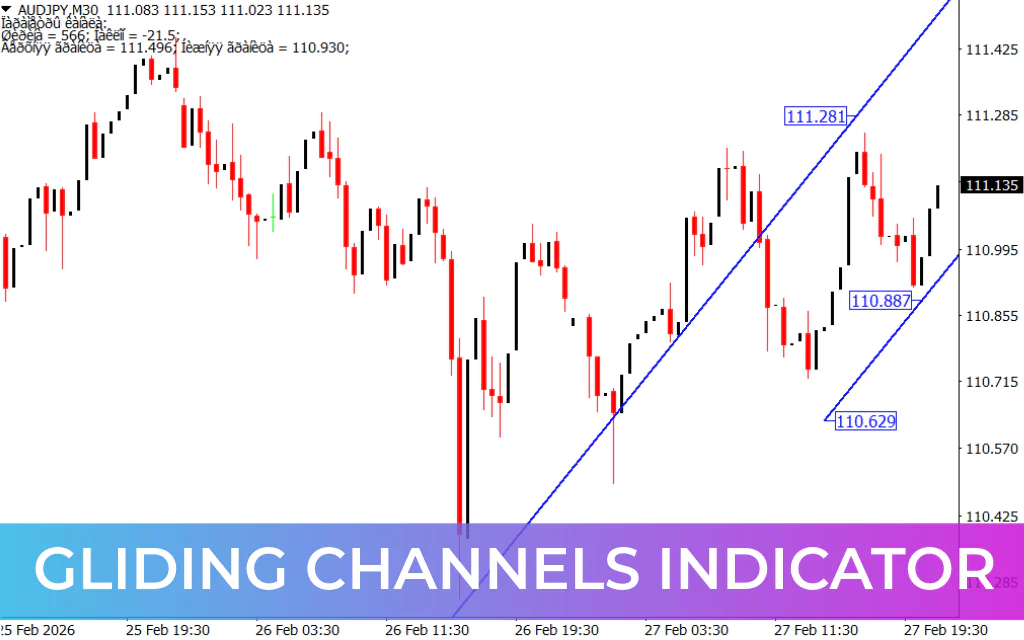
The Gliding Channels Indicator for MT4 is a powerful tool that automatically scans and plots channel patterns on your trading chart. By identifying bullish and bearish channels, it allows traders to focus on trade confirmation, entry, and exit points, rather than manually drawing channels. This makes it a valuable tool for both trend-following and reversal strategies.
The indicator is suitable for intraday and higher timeframes, and it simplifies trading for beginners by automatically detecting channel structures. However, understanding Price Action is recommended to confirm trading signals effectively.
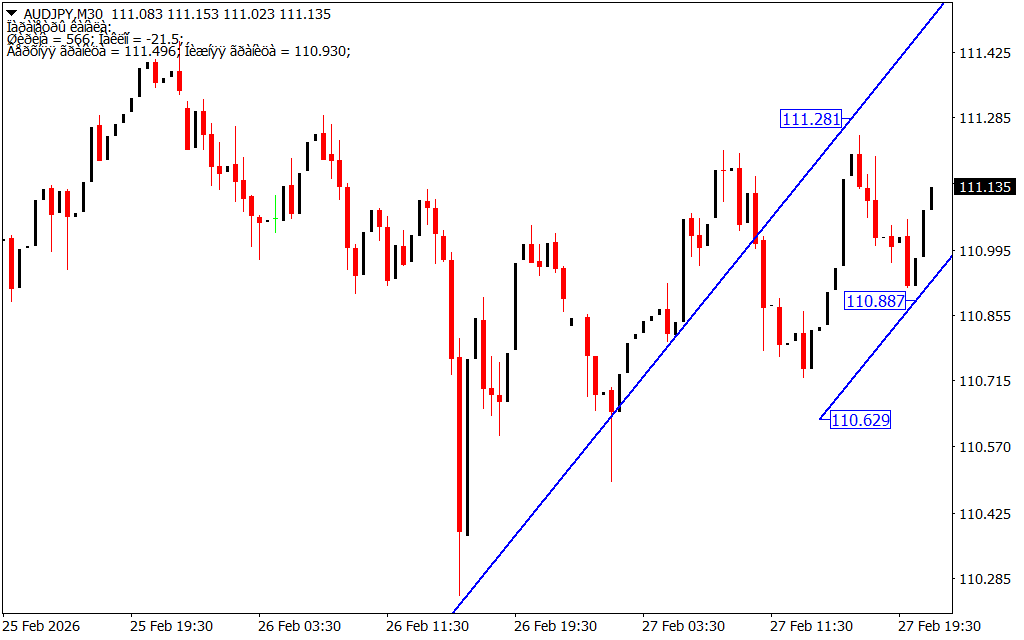
How the Gliding Channels Indicator Works
The indicator plots:
- Bullish and bearish channels automatically
- Price labels at intersections of price and channel lines
Trading strategy:
- Buying Opportunity:
- Price reaches the lower channel line and bounces
- Enter a buy trade with a stop loss based on risk tolerance
- Take profit when price reaches the upper channel line
- Avoid trading if the price breaks below the channel
- Selling Opportunity:
- Price reaches the upper channel line and reverses
- Enter a sell trade with a stop loss above the previous swing high
- Take profit at the lower channel line
- Confirm reversals using price action or other indicators
This approach allows traders to catch trend continuations and breakout opportunities effectively while managing risk.
Benefits of Gliding Channels Indicator
- Automatically identifies and plots channel patterns
- Highlights potential trend reversals and continuations
- Works across intraday and higher timeframe charts
- Suitable for new and advanced traders
- Supports price action-based trade confirmation
Conclusion
The Gliding Channels Indicator for MT4 is an essential tool for traders who want automatic detection of channel patterns. It helps spot potential breakouts, reversals, and trend continuations while letting traders focus on trade confirmation and risk management.
FAQ
5 Downloads
Published:
Mar 01, 2026 07:46 AM
Category: