Free
EMA Trend Indicator for MT4 – Spot Trend Direction with EMA Crossovers
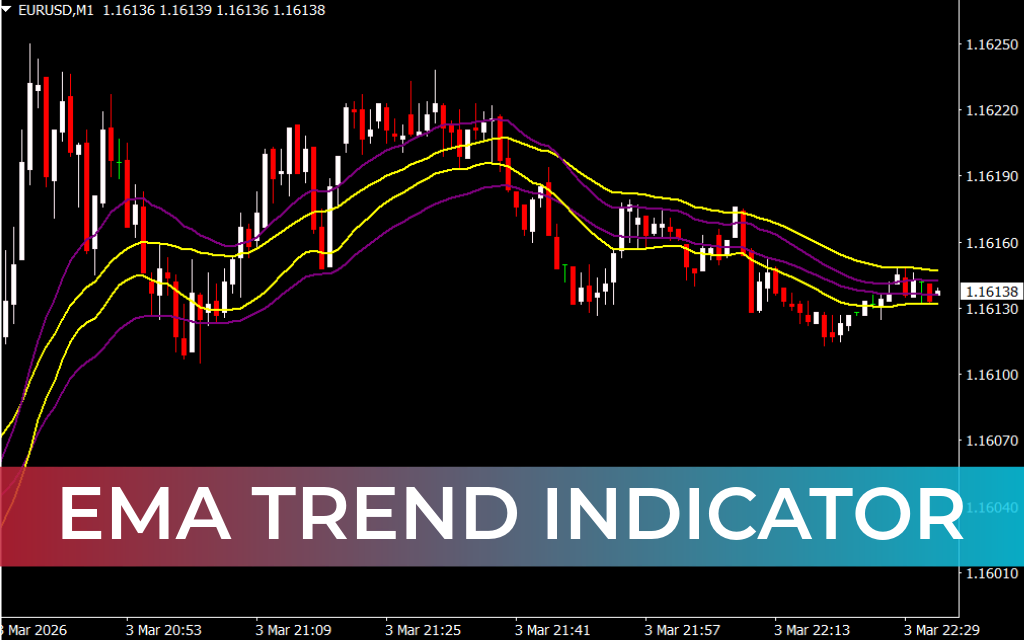
The EMA Trend Indicator for MT4 is a trend-following tool that uses Exponential Moving Averages (EMAs) to identify the market’s momentum. By analyzing the crossover between a fast EMA and a slow EMA, traders can spot potential bullish and bearish trends and determine clear entry and exit points.

Key Features
- Uses two EMAs: fast and slow
- Signals bullish trends when the fast EMA crosses above the slow EMA
- Signals bearish trends when the fast EMA crosses below the slow EMA
- Works on all timeframes, but higher timeframes reduce false signals
- Helps traders identify trend continuation and reversals
How to Use the EMA Trend Indicator for MT4
Step 1: Observe EMA Crossovers
- Bullish signal: Fast EMA (purple) crosses above the slow EMA (yellow).
- Bearish signal: Slow EMA (yellow) crosses above the fast EMA (purple).
Step 2: Confirm the Trend
- Like traditional moving averages, the EMA Trend Indicator uses past price data.
- Combine with other tools like RSI, MACD, or Price Action to reduce false signals.
Step 3: Enter the Trade
- Go long on bullish crossovers, placing stop-loss below recent swing lows.
- Go short on bearish crossovers, placing stop-loss above recent swing highs.
Step 4: Exit Strategy
- Consider exiting trades when the EMAs cross in the opposite direction.
- Optionally, combine with support/resistance levels or trendlines for better timing.
Best Practices
- Use on longer timeframes (H4, Daily) to minimize market noise.
- Avoid trading solely on EMA crossovers in sideways markets.
- Combine with other indicators for Trend Confirmation.
Conclusion
The EMA Trend Indicator for MT4 is a simple yet powerful tool that uses EMA crossovers to indicate market trend direction. By identifying bullish and bearish momentum early, traders can make informed decisions on trade entries and exits.
Download the EMA Trend Indicator for MT4 for free and start spotting clear trend signals today.
FAQ
Uses fast and slow Exponential Moving Averages. Bullish signal: fast EMA (purple) crosses above the slow EMA (yellow). Bearish signal: slow EMA (yellow) crosses above the fast EMA (purple). Analyze crossover to spot potential trends and entry/exit points.
Like traditional MAs, it uses past price data. Combine with other tools like RSI, MACD, or price action to reduce false signals. Higher timeframes reduce false signals.
Go long on bullish crossover (fast above slow). Go short on bearish crossover (slow above fast). Use for trend continuation and reversals.
Works on all timeframes. Higher timeframes reduce false signals. Helps identify trend continuation and reversals.
Market momentum. Potential bullish and bearish trends. Clear entry and exit points.
Published:
Mar 03, 2026 16:35 PM
Category:
Share: