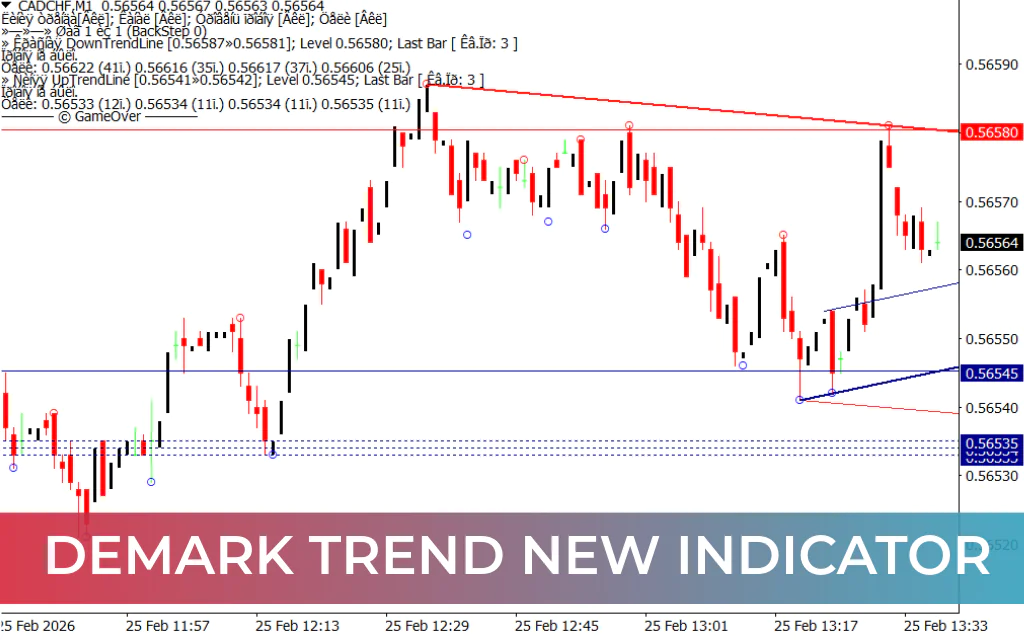
The DeMark Trend New Indicator for MT4 is a powerful technical analysis tool built to help traders identify market trends and potential reversal points with greater accuracy. By automatically plotting dynamic trendlines based on historical Price Action, this indicator eliminates manual drawing and provides a clear, structured view of market direction.
Designed for MetaTrader 4 users, it supports multiple timeframes and adapts to various trading styles — from short-term intraday strategies to long-term trend trading.
Key Features of DeMark Trend New Indicator
Automatic Trendline Drawing
The indicator intelligently identifies key swing highs and lows to draw precise trendlines. This automation saves time and ensures consistent analysis without subjective bias.
Support & Resistance Identification
Plotted trendlines act as dynamic Support And Resistance levels. These levels help traders anticipate:
- Breakouts
- Pullbacks
- Trend continuations
- Reversal setups
Breakout & Reversal Signals
When price interacts with a trendline, the indicator highlights potential trading opportunities:
- Break above a downtrend line – Possible bullish reversal
- Break below an uptrend line – Potential bearish reversal
These signals allow traders to act quickly and confidently.
Additional Market Structure Tools
Beyond trendlines, the indicator may also display:
- Horizontal support and resistance levels
- Channel formations
- Take profit levels
This comprehensive structure gives traders a broader market perspective in one streamlined view.
Customizable Settings
Adjust sensitivity, line appearance, and signal parameters to match your preferred trading strategy and market conditions.
How the DeMark Trend New Indicator Works
The indicator analyzes historical price data to detect significant turning points. Based on these pivot points, it automatically plots trendlines that represent the dominant Market Structure.
As price approaches, tests, or breaks these lines, traders can identify high-probability trade setups. This systematic approach removes emotional decision-making and enhances technical precision.
For best results, combine the indicator with proper risk management and confirmation from additional technical tools.
Why Traders Choose DeMark Trend New Indicator for MT4
- Eliminates manual trendline drawing
- Highlights breakout opportunities
- Works across all timeframes
- Suitable for scalpers and swing traders
- Enhances technical accuracy
- Simplifies market structure analysis
By automating trendline strategies, the indicator helps traders focus more on execution and less on chart preparation.
Final Thoughts
The DeMark Trend New Indicator for MT4 is an essential solution for traders who rely on trendline analysis and structured technical strategies. Its automatic plotting system, breakout signals, and customizable settings make it a valuable addition to any trading setup.
If you want clearer trend identification and more confident breakout trading, this indicator can significantly enhance your technical analysis workflow.
FAQ
3 Downloads
Published:
Feb 25, 2026 07:39 AM
Category: