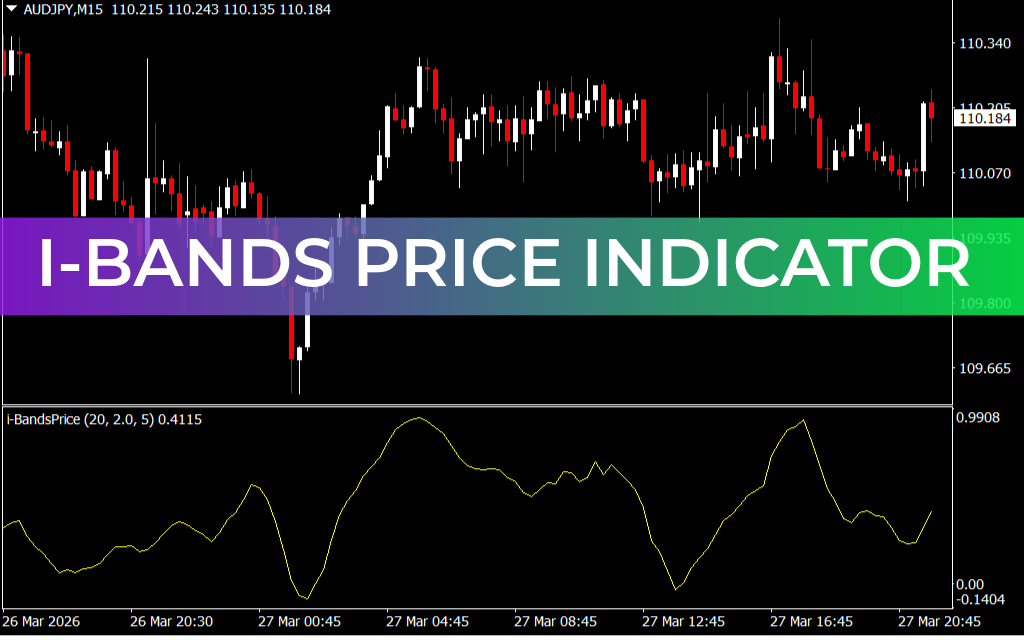
The I-Bands Price Indicator for MetaTrader 4 (MT4) is an advanced oscillating tool designed to evaluate market momentum and detect price exhaustion zones. Unlike traditional Bollinger Bands, this indicator functions as an oscillator, providing traders with clear insights into potential trend reversals and overbought/oversold conditions.
By measuring momentum and price extremes, the I-Bands Price Indicator helps traders make more informed entry and exit decisions across forex and other financial markets.
How the I-Bands Price Indicator Works
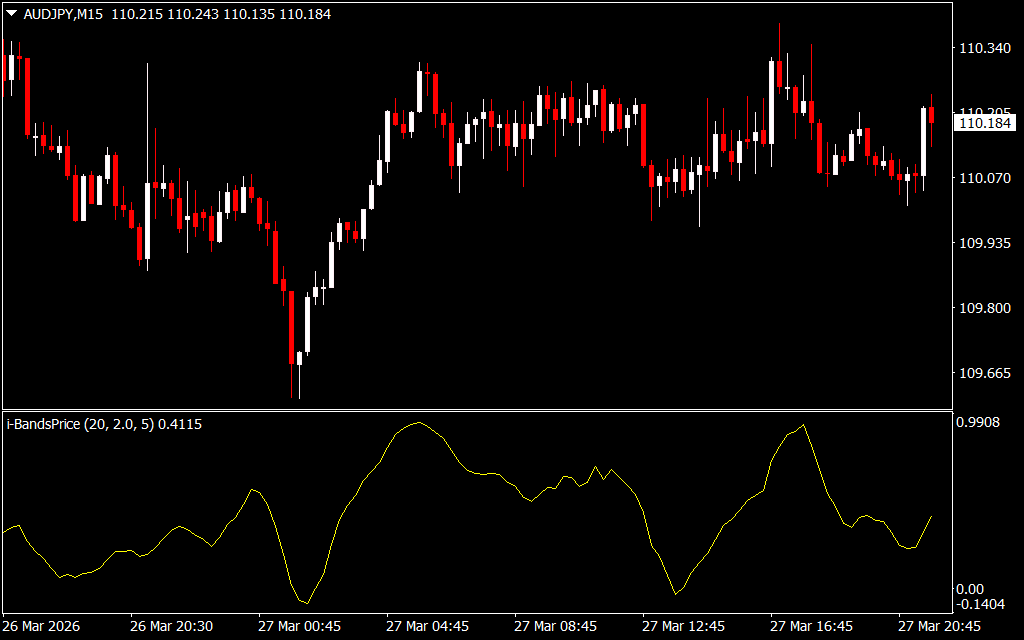
The indicator plots a single oscillator beneath the main price chart, oscillating between 0 and 1, with key reference levels:
- 0.5 Median Line – Determines trend bias:
- Above 0.5 → Bullish bias
- Below 0.5 → Bearish bias
- 0.00 Level → Potential oversold zone
- 1.00 Level → Potential overbought zone
Momentum Analysis
The distance between the oscillator and the median line indicates the strength of momentum:
- Oscillator far above 0.5 → Strong bullish momentum
- Oscillator far below 0.5 → Strong bearish momentum
Trade Setup
- Look for Price Action confirmation near 0.00 or 1.00 zones (e.g., bullish/bearish engulfing patterns) for potential buy or sell entries.
- Use the oscillator in conjunction with trend bias and momentum strength for better trade timing.
Key Features
- Oscillator-based version of Bollinger Bands
- Detects overbought and oversold levels
- Measures momentum and Trend Strength
- Works on all MT4 timeframes
- Suitable for Scalping, intraday, and swing trading
Trading Advantages
- Identifies potential trend reversals early
- Highlights momentum shifts in the market
- Helps anticipate optimal trade entry and exit zones
- Improves risk/reward efficiency by combining trend and exhaustion signals
Conclusion
The I-Bands Price Indicator for MT4 is a versatile tool that combines momentum measurement with overbought/oversold detection. By analyzing the oscillator relative to its median line and extreme levels, traders can better anticipate trend changes and optimize their trade entries and exits.
FAQ
Published:
Mar 27, 2026 18:26 PM
Category: