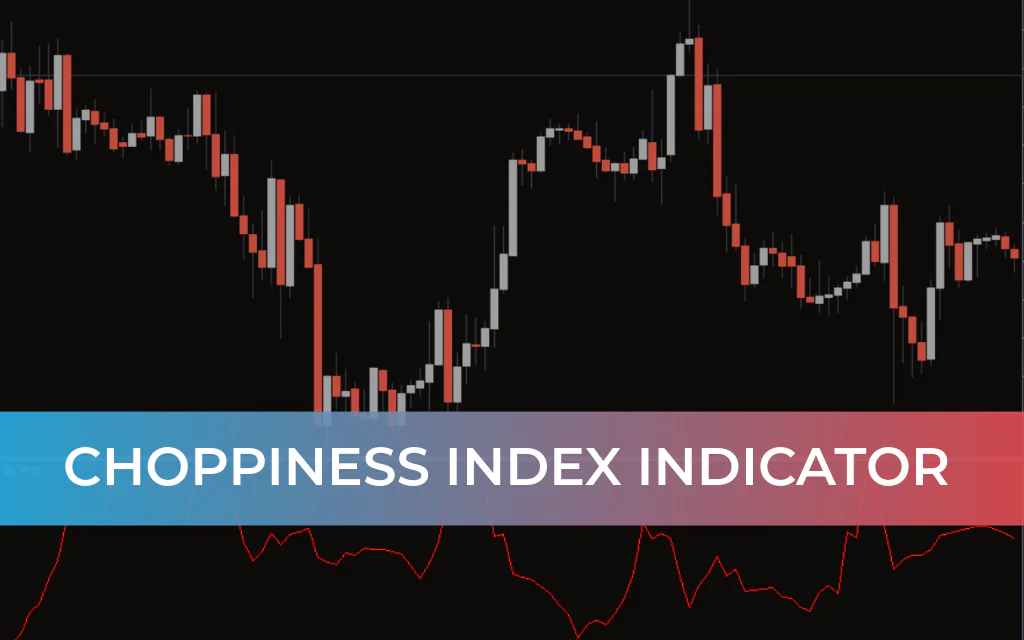
The Choppiness Index Indicator for MetaTrader 4 is a powerful market condition tool that helps traders determine whether the market is trending or moving sideways. By clearly distinguishing between choppy (range-bound) and directional (trending) environments, this indicator enables traders to apply the most suitable technical trading strategy for current conditions.
Understanding Market Structure is essential because many trading strategies perform well only in trending markets or only in ranging markets — rarely both. The Choppiness Index solves this problem by helping traders adapt their strategy accordingly.
How the Choppiness Index Works
The indicator is plotted in a separate window and calculates values using the High and Low price data, based on principles derived from chaos theory and fractal geometry.
Key Levels
Above 61.8 → Market is choppy / sideways
Below 38.2 → Market is trending
When the index breaks below the 38.2 level, it signals that the market may be transitioning into a strong trend. Traders can then prepare to trade breakouts and ride momentum.
Conversely, when the value rises above 61.8, the market is likely consolidating, making range-trading strategies more appropriate.
Default Trading Setup
On a GBPUSD H1 chart, the indicator appears as red lines in a separate window. It helps traders visually identify when the market shifts between consolidation and expansion phases.
When the Choppiness Index falls below 38.2:
Traders look for breakout opportunities
Trend-following strategies become favorable
When the index rises above 61.8:
Range-bound strategies are preferred
Traders focus on Support And Resistance levels
Modified Trading Setup
With customized settings, traders can better visualize the 38.2 and 61.8 levels to clearly define choppy and trending zones.
Trend Continuation Signal
If the indicator reaches the 61.8 level but fails to remain above it and retraces downward for three consecutive movements, traders may interpret this as strengthening trend momentum and continue riding existing positions.
Trading Applications
1. Breakout Trading
Wait for the index to break below 38.2
Enter BUY or SELL positions in the breakout direction
Ride the emerging trend
2. Range Trading
Wait for the index to move above 61.8
Trade between established support and resistance levels
Use channel or consolidation-based strategies
This flexibility makes the indicator highly useful for intraday traders who often encounter sideways markets near channels, trend lines, or key price zones.
Why Traders Use the Choppiness Index
Identifies trending vs sideways conditions
Helps prevent using the wrong strategy in the wrong market
Works on all timeframes (M1 to Monthly)
Suitable for beginners and advanced traders
Supports breakout and range trading strategies
Free to download and easy to install
For new traders, the indicator simplifies market condition analysis. For advanced traders, it becomes a valuable filter within more complex trading systems.
Final Verdict
The Choppiness Index Indicator for MT4 is an essential tool for adapting to changing market conditions. By clearly defining whether the market is trending or consolidating, it reduces costly mistakes and improves strategic decision-making.
However, traders should always confirm signals using Price Action, support and resistance levels, or additional technical indicators before entering trades.
When used correctly, the Choppiness Index becomes a powerful component of a disciplined and adaptable trading strategy.
FAQ
Published:
Feb 20, 2026 00:33 AM
Category: