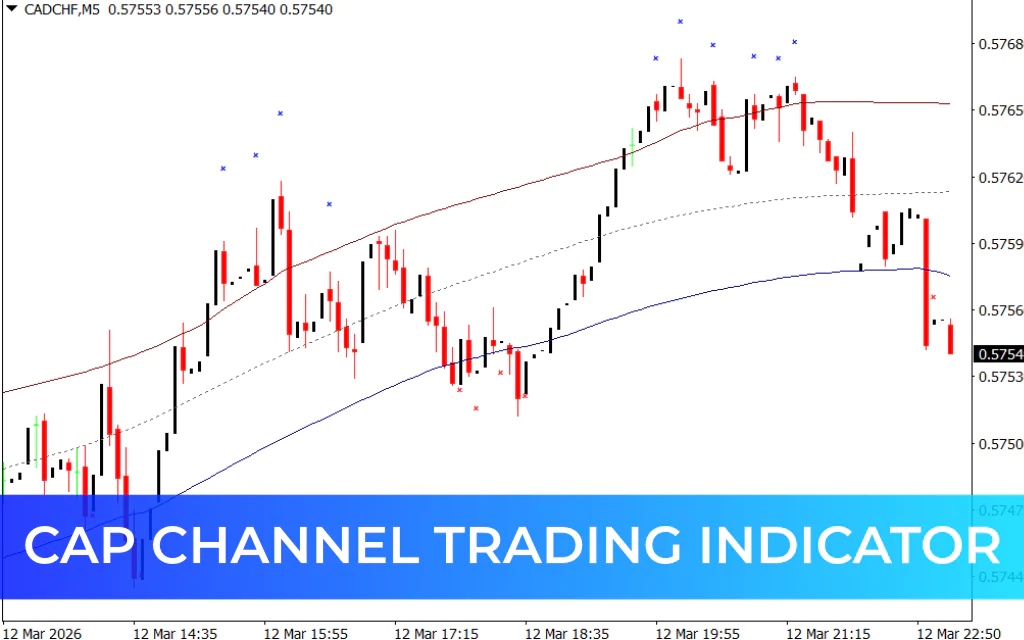
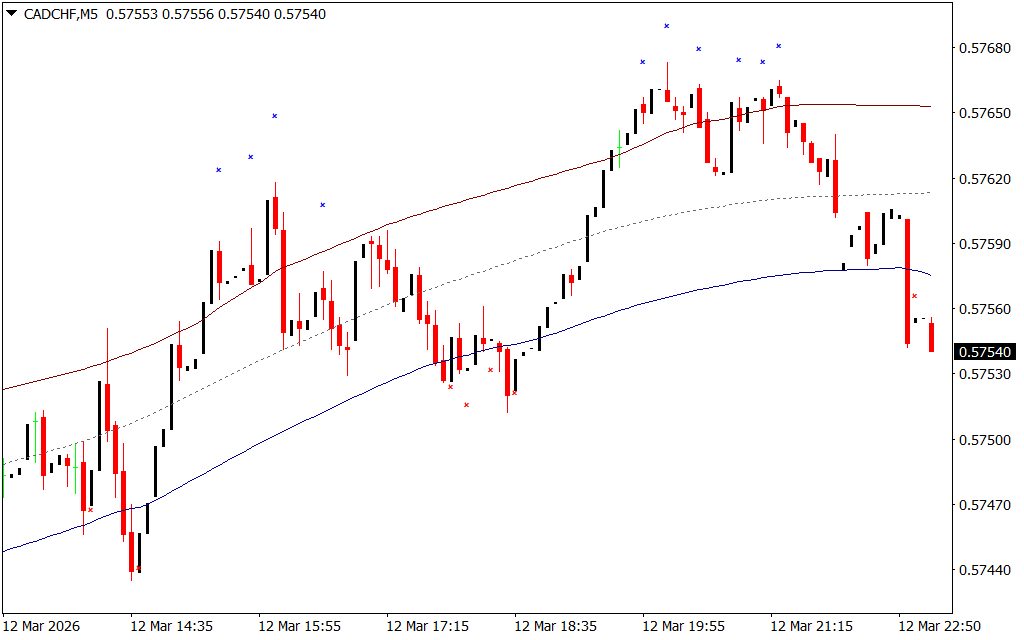
The CAP Channel Trading Indicator for MT4 is a technical analysis tool designed for channel trading strategies. It creates an envelope around price movement, forming an upper and lower channel where price tends to fluctuate.
- Upper channel line: Acts as an overbought zone
- Lower channel line: Acts as an oversold zone
The indicator is volatility-sensitive, meaning it adapts to market conditions by analyzing daily price changes to identify Supply And Demand zones. This helps traders determine entry points, exit levels, and potential trend reversals.
In addition to channel lines, the indicator also plots cross signals (red and blue) to highlight possible market reversal opportunities.
The CAP Channel indicator works well for multiple instruments and currency pairs and is suitable for short-term and long-term trading, especially on 15-minute and higher timeframes.
How the CAP Channel Indicator Works
The indicator plots two channel boundaries around Price Action:
- Upper Band (Resistance / Overbought)
- Lower Band (Support / Oversold)
Price tends to move within this channel, and when it reaches one of the boundaries, the probability of a reversal or correction increases.
Buy Signal
A buy opportunity occurs when:
- Price reaches the lower channel band (oversold zone)
- The indicator displays a red cross, signaling a potential bullish reversal
- Traders may enter a buy position after a bullish candle closes
Stop Loss:
- Place below the recent swing low
Take Profit / Exit:
- When price reaches the upper channel band
- Or when the indicator shows a blue cross signaling a possible reversal
Sell Signal
A sell opportunity occurs when:
- Price touches the upper channel band (overbought zone)
- The indicator prints a blue cross, indicating a potential bearish reversal
- Traders may open a sell position after confirmation from a bearish candle
Stop Loss:
- Place above the recent swing high
Take Profit / Exit:
- When price touches the lower channel band
- Or when the indicator prints a red cross
Example Trading Scenario
On a Gold (XAU/USD) chart, the price often moves between the upper red line and lower blue line, forming a clear channel.
- When price touches the upper red line, it signals a possible overbought condition and potential downward reversal. The indicator confirms this with a blue cross.
- When price reaches the lower blue line, it suggests the market is oversold, and a red cross appears indicating a potential bullish reversal.
Traders can take advantage of these signals to enter trades at channel extremes and exit at the opposite boundary.
Advantages of the CAP Channel Indicator
- Ideal for channel trading strategies
- Identifies overbought and oversold zones
- Provides clear reversal signals using cross markers
- Adapts to market volatility
- Suitable for multiple assets and currency pairs
- Works well on 15-minute and higher timeframes
- Helps traders determine entries, exits, and trend reversals
- Free to download and install on MT4
Conclusion
The CAP Channel Trading Indicator for MT4 is a valuable tool for traders who rely on channel and mean-reversion strategies. By identifying overbought and oversold zones within a volatility-based channel, it allows traders to spot high-probability reversal opportunities. When combined with price ac
FAQ
4 Downloads
Published:
Mar 12, 2026 18:15 PM
Category: