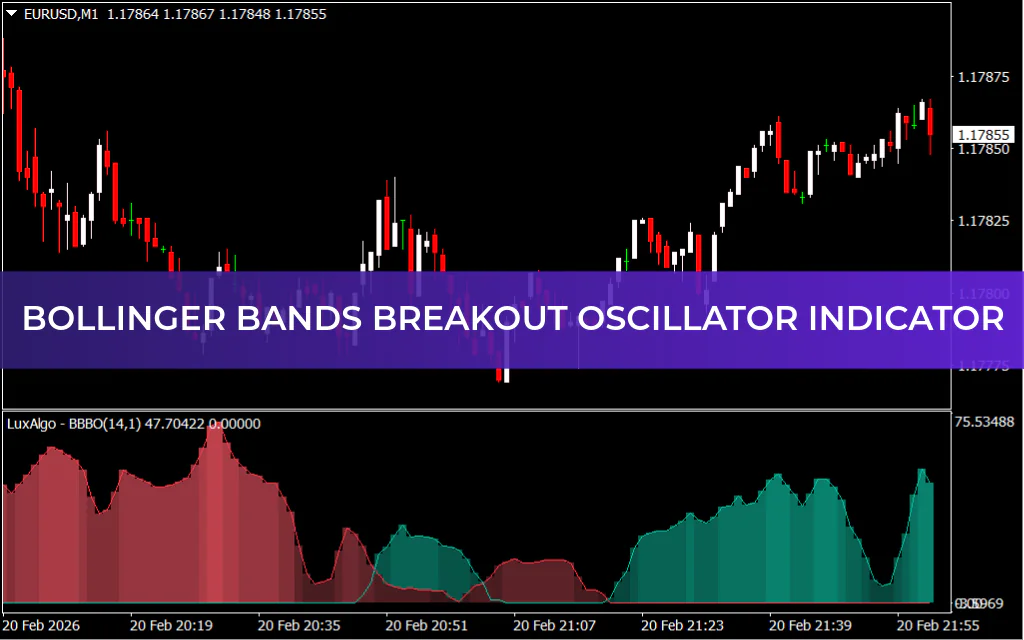
The Bollinger Bands Breakout Oscillator Indicator for MetaTrader 4 by LuxAlgo transforms traditional Bollinger Bands analysis into a powerful, easy-to-read oscillator. Designed specifically for the MetaTrader 4 platform, this advanced volatility tool converts band expansion and contraction into a dynamic histogram format—allowing traders to instantly recognize breakout strength and momentum shifts.
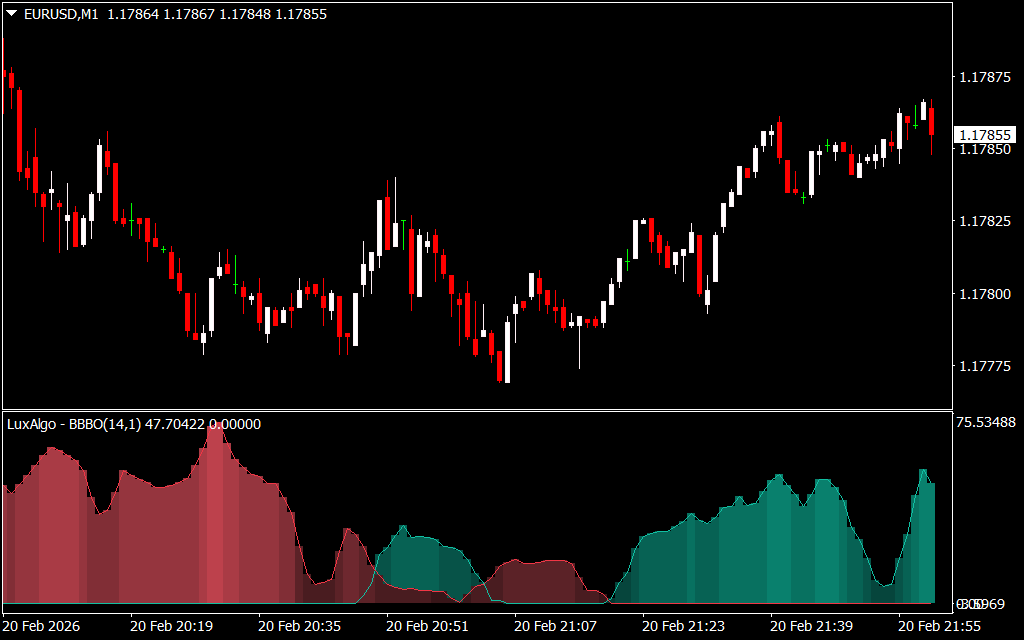
Instead of plotting standard Bollinger Bands directly on the price chart, this oscillator compresses volatility data into color-coded waves. The result is a clean and focused display that helps traders identify explosive price movements, trend continuation phases, and potential exhaustion zones without cluttering their charts.
Whether you're trading forex, indices, commodities, or crypto, this indicator enhances decision-making with clear, actionable volatility insights.
How the Bollinger Bands Breakout Oscillator Works
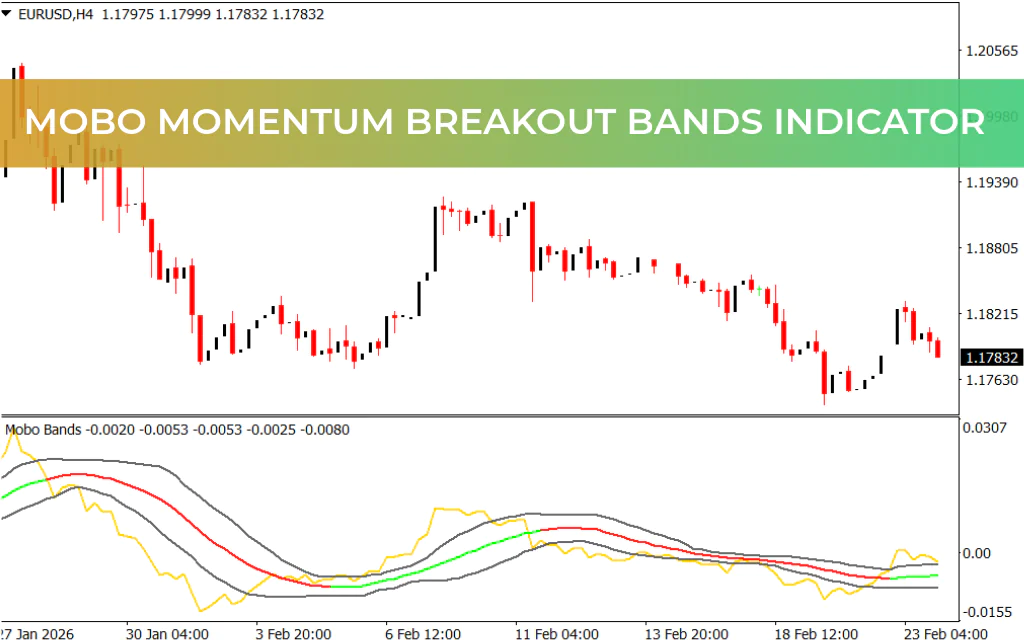
The oscillator measures breakout pressure by analyzing Bollinger Band expansion and translating it into histogram bars:
- Green Bars – Indicate bullish volatility expansion and increasing buying pressure
- Red Bars – Signal bearish breakout strength and growing selling momentum
- Contracting Bars – Suggest fading momentum and potential consolidation or reversal
- Zero Line – Acts as a baseline; movement away from zero reflects breakout pressure, while a return toward zero implies volatility contraction
This visual structure makes it easy to:
- Confirm breakout strength
- Filter out false volatility spikes
- Identify trend continuation setups
- Anticipate possible reversals
- Optimize entry, exit, and stop-loss placement
By monitoring the expansion and contraction cycles, traders can align positions with genuine market momentum rather than reacting to short-term noise.
Why Traders Choose This Indicator
1. Clear Histogram Visualization
The oscillator-style format simplifies volatility analysis, eliminating the complexity of traditional band overlays.
2. Accurate Breakout Confirmation
It helps distinguish between real breakout momentum and temporary price spikes.
3. Volatility-Based Entry Timing
Traders can time entries during expansion phases and tighten risk during contraction phases.
4. Works Across Multiple Strategies
Ideal for breakout, momentum, Scalping, and trend-following systems.
5. Clean & User-Friendly Design
The color-coded histogram ensures clarity across all market conditions.
Trading Signals and Strategy Application
When the histogram expands strongly away from the zero line, it indicates growing breakout pressure. This often aligns with strong directional moves and trend acceleration.
As the bars begin to shrink after reaching extreme levels, momentum may be weakening. This phase can signal:
- Profit-taking opportunities
- Trend exhaustion
- Potential consolidation
- Early reversal setups
By combining the oscillator with price structure, Support And Resistance, or higher timeframe analysis, traders can significantly improve signal reliability.
Conclusion
The Bollinger Bands Breakout Oscillator Indicator for MetaTrader 4 by LuxAlgo redefines how traders analyze volatility and breakout behavior. Its histogram-based layout delivers clear, actionable signals that help identify expanding momentum and fading pressure in real time.
With intuitive settings and a practical alert system, this indicator is suitable for beginners and advanced traders alike. If you're looking to trade breakouts with greater confidence and precision, this volatility oscillator provides the tactical edge needed to stay ahead of the market.
FAQ
Published:
Feb 22, 2026 16:50 PM
Category: