Free
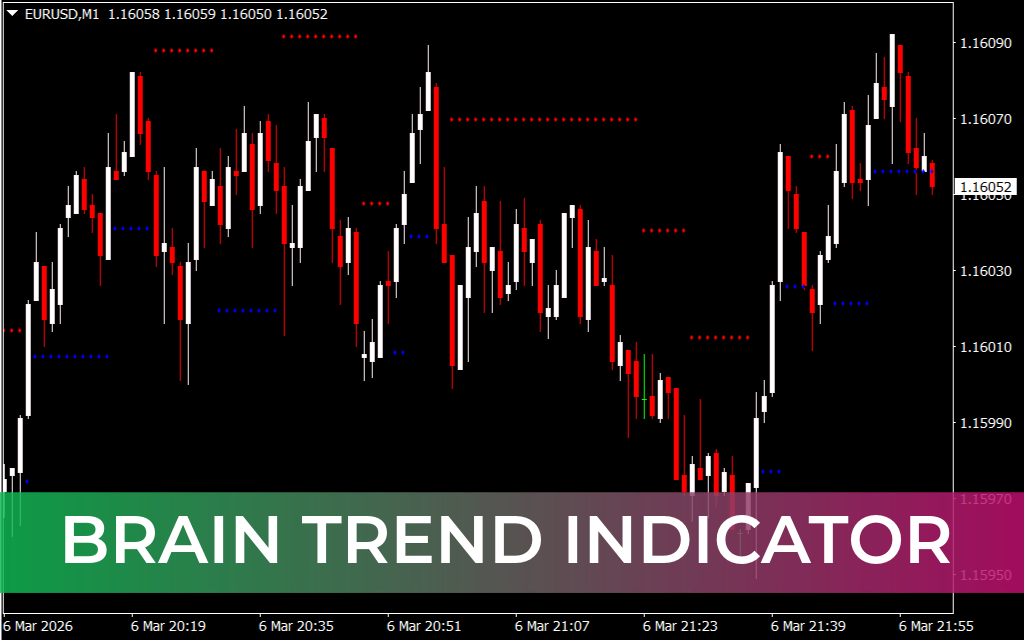
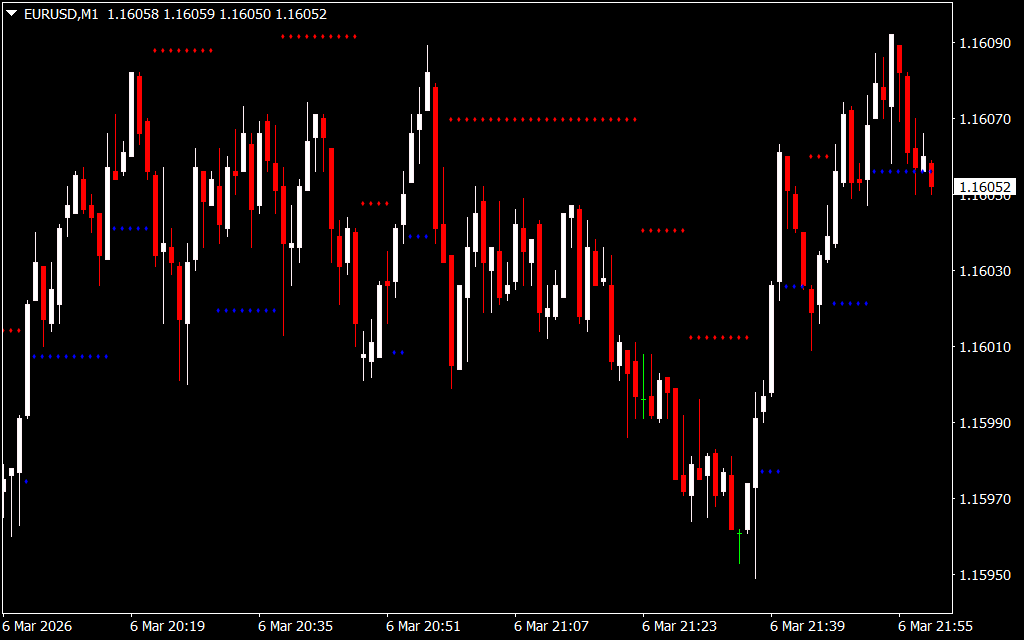
The Brain Trend Indicator is a simple MT4 indicator designed to identify the overall trend direction and potential Trend Reversal zones. It uses dotted lines on the chart to help traders visualize support, resistance, and momentum clearly.
Key Features
- Trend Direction Detection
- Blue dotted lines indicate bullish momentum (uptrend).
- Red dotted lines indicate bearish momentum (downtrend).
- Support And Resistance Levels
- Blue lines act as support levels, providing potential entry points for long trades.
- Red lines act as resistance levels, highlighting areas to consider short trades.
- Entry & Exit Guidance
- Buy signal: Blue dotted line appears and next candle closes bullish.
- Sell signal: Red dotted line appears and next candle closes bearish.
- Wait for confirmation candles to avoid entering on false signals.
- Trend Reversal Indication
- Red dotted lines can appear in an uptrend, while blue dotted lines can appear in a downtrend, signaling possible reversals.
- Timeframe Flexibility
- Can be applied on any timeframe, but higher timeframes are recommended to reduce noise and false signals.
- Handling False Breakouts
- Wait for price to break below support or above resistance before entering the trade.
- This approach reduces the risk of being trapped by minor retracements.
How to Trade With Brain Trend Indicator
- Long Entry (BUY)
- Blue dotted line appears (support).
- Wait for a bullish confirmation candle above support.
- Enter long, place stop loss slightly below the support line.
- Short Entry (SELL)
- Red dotted line appears (resistance).
- Wait for a bearish confirmation candle below resistance.
- Enter short, place stop loss slightly above the resistance line.
- Exit Trades
- Close long trades if red dotted lines appear and bearish confirmation occurs.
- Close short trades if blue dotted lines appear and bullish confirmation occurs.
- Combining With Other Indicators
- Combine with RSI, MACD, or moving averages to filter false signals.
- Helps confirm trend reversals or continuation zones.
Example Usage
- EUR/USD H1 chart:
- Blue dotted line forms at a support zone.
- Next candle closes bullish → enter long.
- Price respects the support and continues upward.
- GBP/USD H4 chart:
- Red dotted line forms at resistance.
- Next candle closes bearish → enter short.
- Price begins a downward trend after the small consolidation.
Benefits
- Identifies trend direction clearly using color-coded dotted lines.
- Highlights support and resistance levels for precise entry and exit points.
- Signals potential trend reversals for better timing of trades.
- Works on multiple timeframes to suit scalpers, intraday, and swing traders.
- Free to download and easy to integrate with other MT4 indicators.
Conclusion
The Brain Trend Indicator for MT4 is a versatile tool that draws red and blue dotted lines to indicate bullish/bearish momentum, support/resistance, and potential reversals. It’s perfect for traders looking for clear visual cues to plan entry, exit, and reversal trades. For improved accuracy, combine it with other technical indicators or Price Action analysis.
FAQ
Blue dotted lines = bullish momentum (uptrend), act as support. Red dotted lines = bearish momentum (downtrend), act as resistance.
Buy: blue dotted line appears and next candle closes bullish. Sell: red dotted line appears and next candle closes bearish. Wait for confirmation candles.
Red dotted lines can appear in uptrend, blue in downtrend, signaling possible reversals. Handle false breakouts by waiting for price to break support/resistance.
Traders wanting to identify trend direction and reversal zones. Simple MT4 indicator. Uses dotted lines for support, resistance, momentum.
Support and resistance levels. Momentum clearly. Trend direction.
Published:
Mar 06, 2026 17:02 PM
Category:
Share: