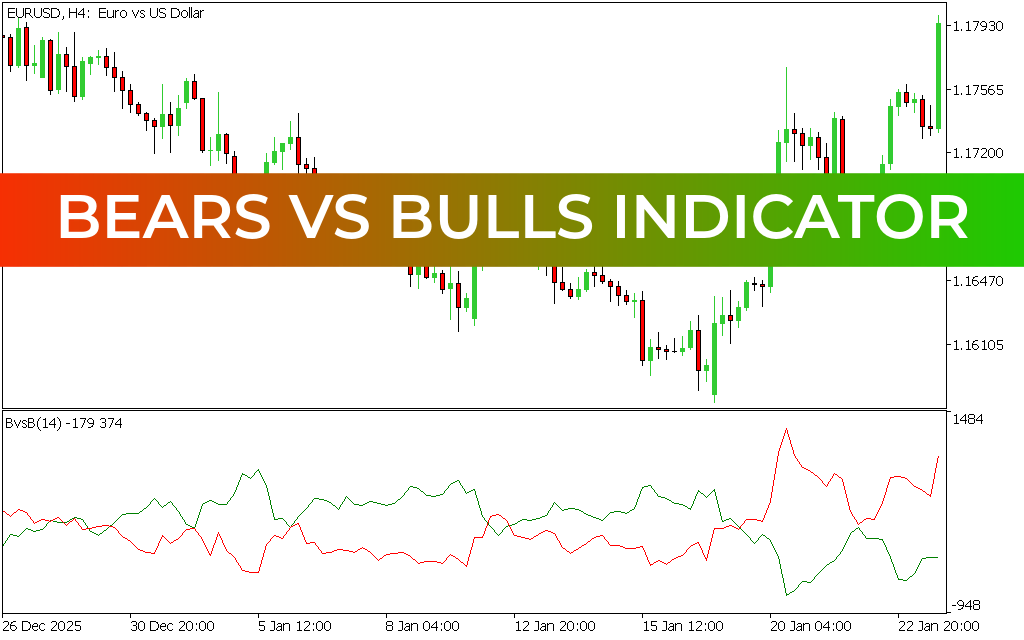
he Bears vs Bulls Indicator for MT5 is a technical analysis tool designed to measure the strength of buyers (bulls) and sellers (bears) in the market. It helps traders quickly identify whether bullish or bearish pressure is dominating Price Action, making it easier to spot potential buy and sell opportunities.
This indicator is also conceptually related to the Elder-Ray Index, which evaluates the balance between buying and selling strength in the market.
What Is the Bears vs Bulls Indicator?
In forex trading:
- Bulls represent buyers pushing prices upward
- Bears represent sellers pushing prices downward
The Bears vs Bulls Indicator visualizes this battle by comparing bullish and bearish momentum using two colored lines, allowing traders to interpret market sentiment at a glance.
Key Features of Bears vs Bulls Indicator for MT5
- Displays strength of buyers vs sellers
- Uses two lines (bulls and bears) for comparison
- Helps identify trend direction and momentum shifts
- Works across all forex pairs and timeframes
- Can be combined with other indicators like:
- Moving Averages (EMA)
- Bollinger Bands
- RSI or MACD
How the Indicator Works
The indicator plots:
- Red line → Bulls (buying pressure)
- Green line → Bears (selling pressure)
The relationship between these two lines determines trading signals.
BUY and SELL Signals Explained
Buy Signal
A buy opportunity occurs when:
- The red line (bulls) rises above the green line
- Buyers are gaining control of the market
- Upward momentum is increasing
Action: Consider entering a buy trade after confirmation from price action or trend indicators.
Sell Signal
A sell opportunity occurs when:
- The green line (bears) rises above the red line
- Sellers are dominating the market
- Downward momentum is strengthening
Action: Consider entering a sell trade with confirmation from candlestick patterns or resistance levels.
How to Use the Bears vs Bulls Indicator Effectively
To improve accuracy, traders should not rely on this indicator alone. It works best when combined with:
- Trend indicators (EMA): to confirm direction
- Bollinger Bands: to detect volatility and extremes
- Support & resistance levels: for better entry timing
- Price action patterns: for confirmation signals
This multi-tool approach helps reduce false signals and improves trade reliability.
Trading Strategy Example
- In an uptrend, wait for red line dominance before entering buys
- In a downtrend, wait for green line dominance before entering sells
- Use pullbacks for better entry points
- Exit trades when line crossover signals reversal
Best Timeframes
The Bears vs Bulls Indicator works on all timeframes, but is most effective on:
- M30 and H1 for intraday trading
- H4 and Daily charts for swing trading
Higher timeframes generally provide stronger and more reliable signals.
Conclusion
The Bears vs Bulls Indicator for MT5 is a simple yet effective tool for understanding market sentiment. By comparing buying and selling pressure, it helps traders identify potential trend direction and reversal opportunities.
When combined with technical indicators like EMA, Bollinger Bands, and price action strategies, it can significantly improve trading accuracy and decision-making.
4 Downloads
Published:
Apr 13, 2026 08:27 AM
Category: