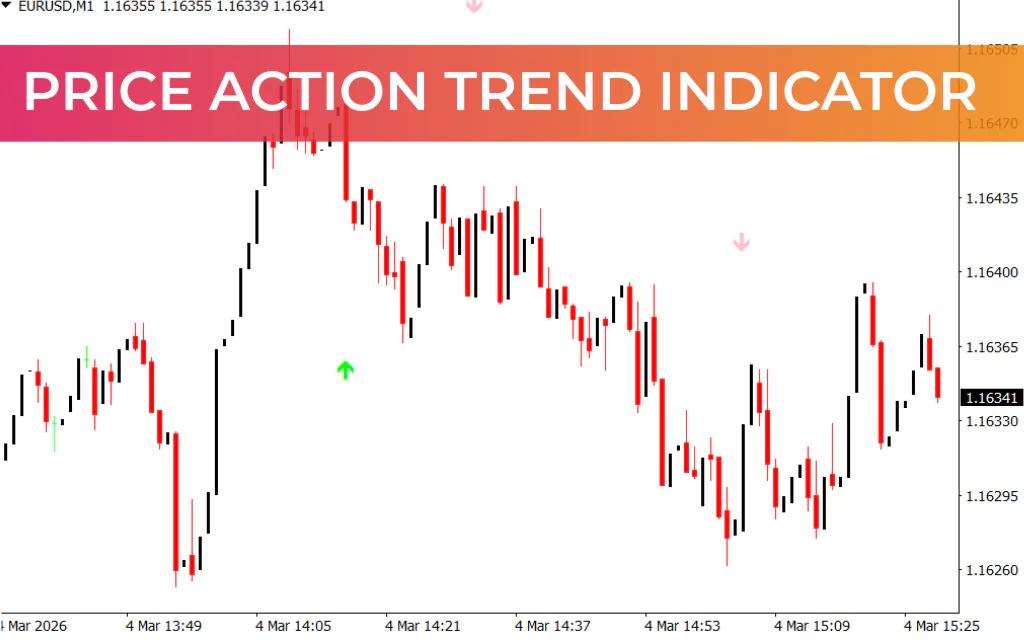
The Price Action Trend Indicator is a straightforward MT4 tool that helps traders quickly identify market trends using visual arrows. By displaying up (lime) and down (pink) arrows, it provides clear signals for potential trade entries.
How the Price Action Trend Indicator Works
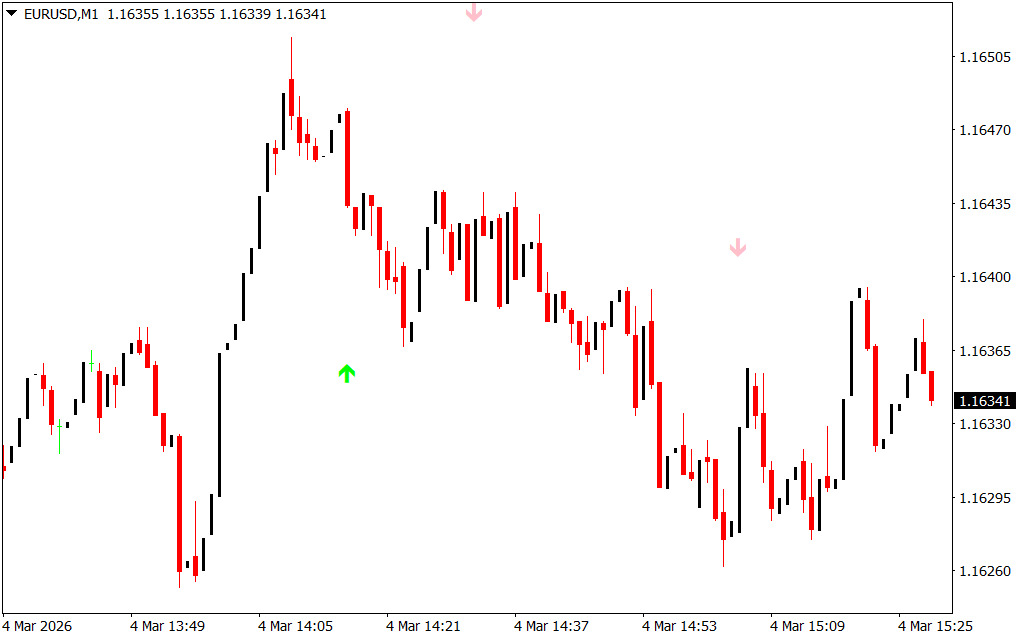
The indicator plots arrows directly on the chart to indicate trend direction:
- Lime arrow pointing up – signals a potential buy opportunity
- Pink arrow pointing down – signals a potential sell opportunity
While the indicator works on all timeframes, shorter timeframes may produce false signals. Traders can minimize risk by identifying the overall trend on a longer timeframe and entering trades accordingly.
How to Use the Price Action Trend Indicator
- Entry Signals:
- Enter a long trade when a lime arrow appears.
- Enter a short trade when a pink arrow appears.
- Confirming Trends:
- The indicator may repaint, meaning arrows can appear during candlestick formation but disappear after it closes. Wait for confirmation before entering.
- Trend Continuation and Reversal:
- Multiple arrows may appear within the same trend. These arrows can indicate either trend continuation or a potential reversal.
- Combine with Other Indicators:
- Use tools like MACD or RSI to confirm signals and improve trading accuracy.
Conclusion
The Price Action Trend Indicator for MT4 simplifies trend analysis by plotting up and down arrows for easy entry and exit points. It’s ideal for traders seeking a visual, easy-to-read tool to identify market direction. You can download the Price Action Trend Indicator for free and start spotting trends more effectively.
FAQ
Published:
Mar 04, 2026 09:31 AM
Category: