The AutoFib TradeZones indicator is a powerful price-level analysis tool for MT4 that automatically plots Fibonacci retracement levels on the chart. Fibonacci analysis is widely used by traders worldwide, making this indicator suitable for trading forex, stocks, cryptocurrencies, commodities, and other financial instruments.
This indicator focuses on identifying potential pullback zones during trending markets. By automatically calculating Fibonacci levels between recent market highs and lows, AutoFib TradeZones helps traders quickly locate potential entry, exit, and reversal areas without manually drawing Fibonacci tools.
It works on all timeframes, from 1-minute charts for Scalping to monthly charts for long-term trading, making it a versatile tool for both intraday and swing traders.
Key Features of AutoFib TradeZones
- Automatic Fibonacci Levels: Instantly plots retracement levels based on recent price highs and lows.
- Trade Zones Visualization: Highlights key buy and sell zones directly on the chart.
- Multi-Timeframe Support: Works on timeframes from M1 to monthly charts.
- Price Action Friendly: Ideal for traders who use candlestick patterns and support/resistance analysis.
- Multi-Market Compatibility: Suitable for forex, stocks, commodities, and cryptocurrencies.
How AutoFib TradeZones Works
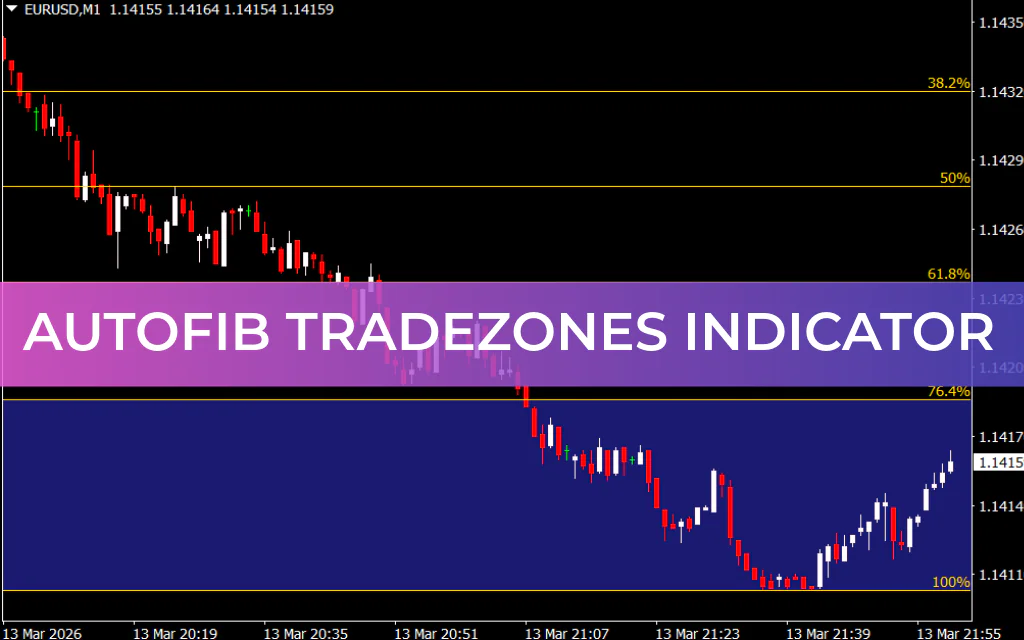
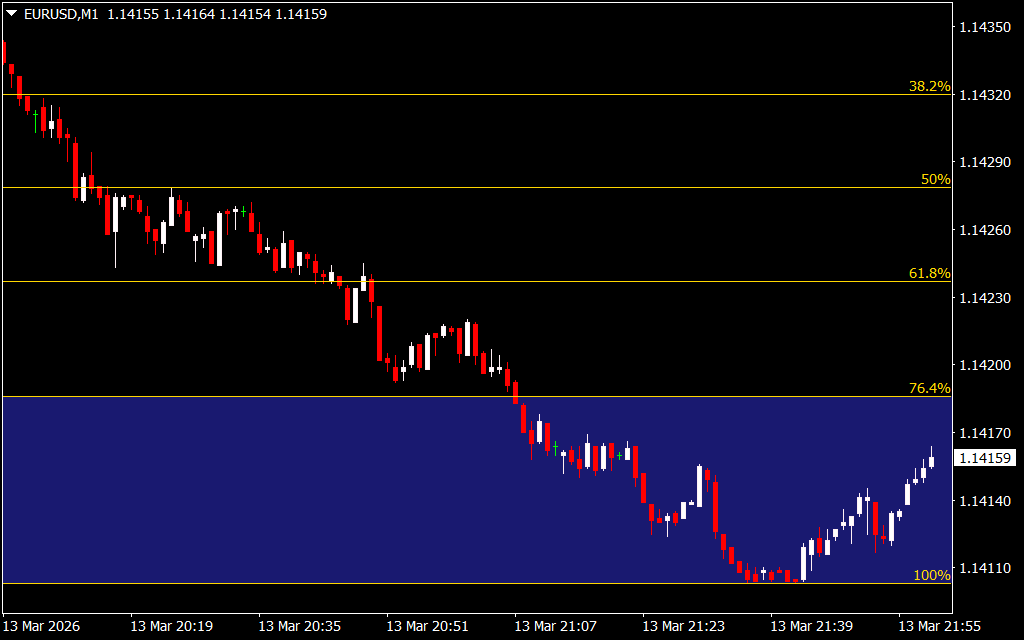
The indicator automatically measures the distance between the latest swing high and swing low and plots six key Fibonacci retracement levels:
- 23.6%
- 38.2%
- 50%
- 61.8%
- 76.4%
- 100%
These levels help traders identify areas where the price may retrace before continuing the main trend.
- Blue Zone (Bottom): Indicates a potential buy zone.
- Red Zone (Top): Indicates a potential sell zone.
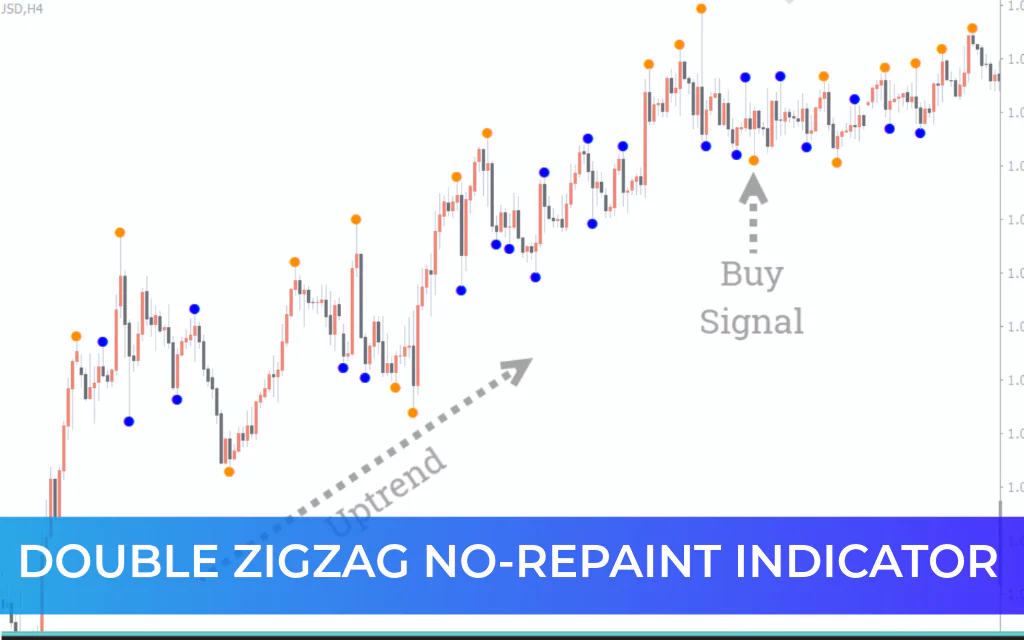
Identifying Buy Signals
When the price is trending upward and retraces toward Fibonacci levels such as 38.2% or 50%, traders can look for bullish price-action signals like pin bars or bullish engulfing patterns. If the price rejects these levels, it may signal a continuation of the uptrend.
Identifying Sell Signals
When the price reaches the red zone near the top, traders can anticipate a potential reversal or profit-taking opportunity. If the price fails to hold above the zone, it may indicate a possible sell setup.
Stop-Loss and Exit Strategy
- Place the stop-loss near the nearest Fibonacci level below the entry point.
- Exit long positions when the price reaches the red sell zone.
- Exit short positions if the price breaks above the blue buy zone.
Why Traders Use AutoFib TradeZones
The indicator simplifies Fibonacci trading by eliminating the need for manual calculations. It provides clear retracement levels and visual trade zones that help traders make faster and more accurate decisions. This makes it especially useful for traders who rely on price action and support/resistance analysis.
Conclusion
The AutoFib TradeZones Indicator for MT4 is an excellent tool for identifying precise retracement levels and trade zones. With automatic Fibonacci plotting, clear buy/sell areas, and compatibility with all timeframes, it’s a valuable addition to any trader’s toolkit. Best of all, it’s free to download and easy to integrate into your MT4 trading strategy.
FAQ
4 Downloads
Published:
Mar 13, 2026 18:19 PM
Category: