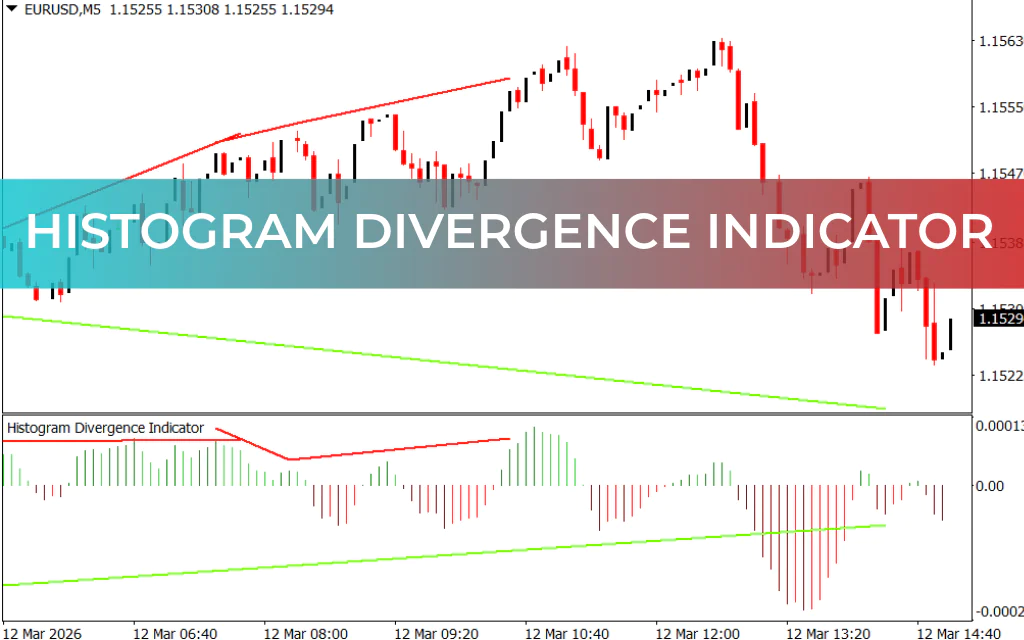
The Histogram Divergence Indicator for MT4 is a powerful technical analysis tool that automatically detects and plots divergence signals on the chart. Built for the MetaTrader 4 platform, the indicator uses the well-known MACD – Moving Average Convergence and Divergence to identify differences between price movement and momentum.
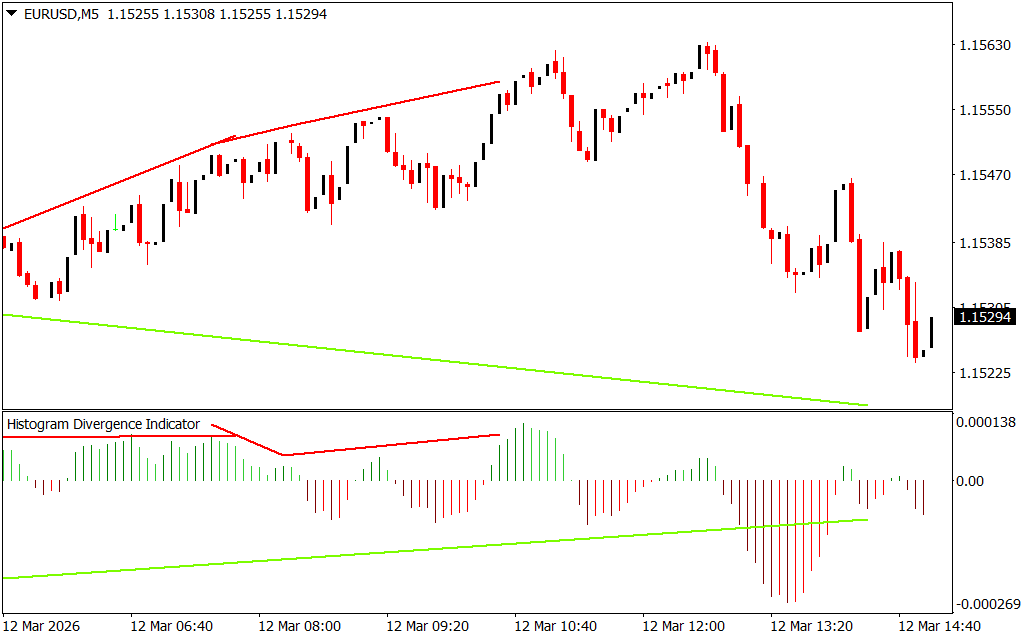
By automatically drawing bullish and bearish divergence lines, the indicator helps traders quickly spot potential market reversals and identify optimal buy and sell opportunities. The divergence lines are displayed directly on the price chart and the indicator window, making analysis easier and faster for both beginners and experienced traders.
The indicator works effectively across all timeframes, including intraday charts and higher timeframes such as daily, weekly, and monthly charts.
How the Histogram Divergence Indicator Works
The indicator displays a MACD histogram using different color variations:
- Dark Green / Green – Bullish momentum
- Dark Red / Red – Bearish momentum
Divergence occurs when price movement and indicator momentum move in opposite directions. This often signals that the current trend is weakening and may soon reverse.
Once divergence is detected, the indicator automatically draws trend lines connecting the relevant points on both the price chart and the MACD histogram, helping traders quickly visualize the setup.
Bullish Divergence Signal
A bullish divergence occurs when:
- Price forms lower lows
- The indicator forms higher lows
When this happens, the indicator plots a divergence line below the price, suggesting a potential upward reversal.
Trading Approach:
- Wait for confirmation of the bullish signal.
- Enter a Buy trade after price shows signs of reversal.
- Place the stop loss below the previous swing low.
- Set profit targets using a favorable risk-reward ratio.
Bearish Divergence Signal
A bearish divergence occurs when:
- Price forms higher highs
- The indicator forms lower highs
In this case, the indicator draws a divergence line above the price, indicating a potential bearish reversal.
Trading Approach:
- Confirm the divergence signal using additional analysis.
- Enter a Sell trade when bearish momentum appears.
- Place the stop loss above the previous swing high.
Important Considerations for Divergence Trading
Divergence trading focuses on identifying Trend Reversal points, but not every signal leads to an immediate reversal. Sometimes divergence appears early while the existing trend continues for some time.
To improve accuracy, traders should combine divergence signals with additional technical tools such as:
- RSI – Relative Strength Index
- Support And Resistance levels
- Trendlines and price channels
- Price Action confirmation
Divergences that occur near strong support or resistance zones generally produce more reliable results.
Timeframe Considerations
- Higher timeframes (Daily, Weekly, Monthly):
- Produce fewer signals
- Often lead to larger and longer price moves
- Lower timeframes (M1, M5, M15):
- Generate signals more frequently
- Suitable for scalpers and intraday traders
Because of this flexibility, the indicator can be used by scalpers, day traders, and swing traders alike.
Conclusion
The Histogram Divergence Indicator for MT4 is a valuable tool for traders who rely on divergence analysis to anticipate market reversals. By automatically detecting and drawing divergence signals using the MACD histogram, it simplifies technical analysis and helps traders identify potential trading opportunities faster.
However, since divergence signals can sometimes appear early, traders should always confirm the setup using price action and additional technical indicators before entering the market.
FAQ
Published:
Mar 12, 2026 10:06 AM
Category: