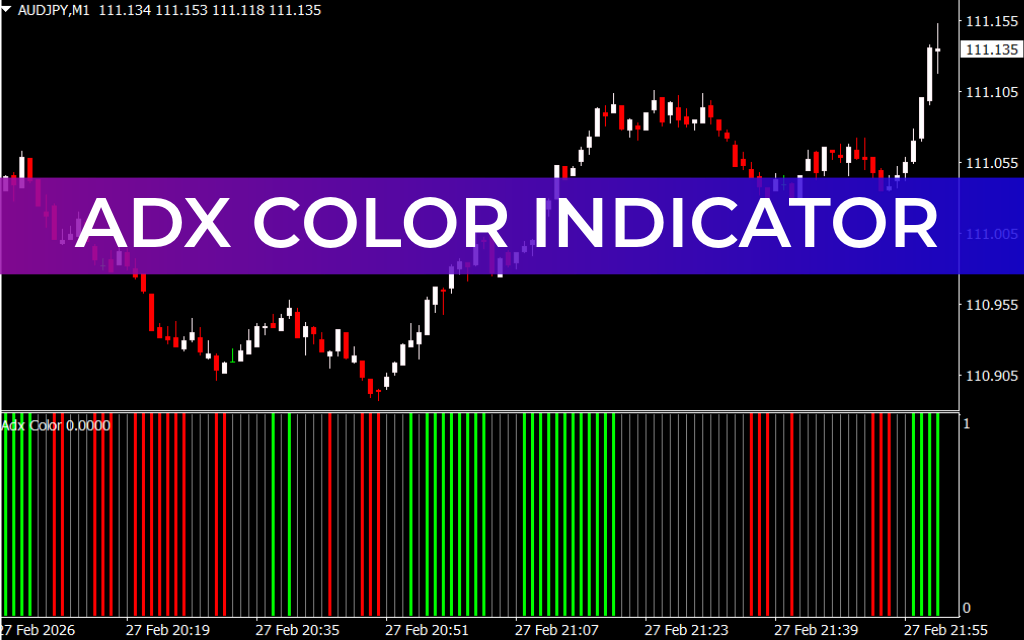
The ADX Color Indicator is a modified version of the traditional Average Directional Index (ADX) that comes with MetaTrader platforms. While the standard ADX uses multiple oscillating lines that can be complex for beginners, the ADX Color indicator simplifies interpretation by displaying color-coded histogram bars to represent market Trend Strength.
This visual approach makes it easier for traders to quickly determine whether the market is trending or ranging.
How the ADX Color Indicator Works
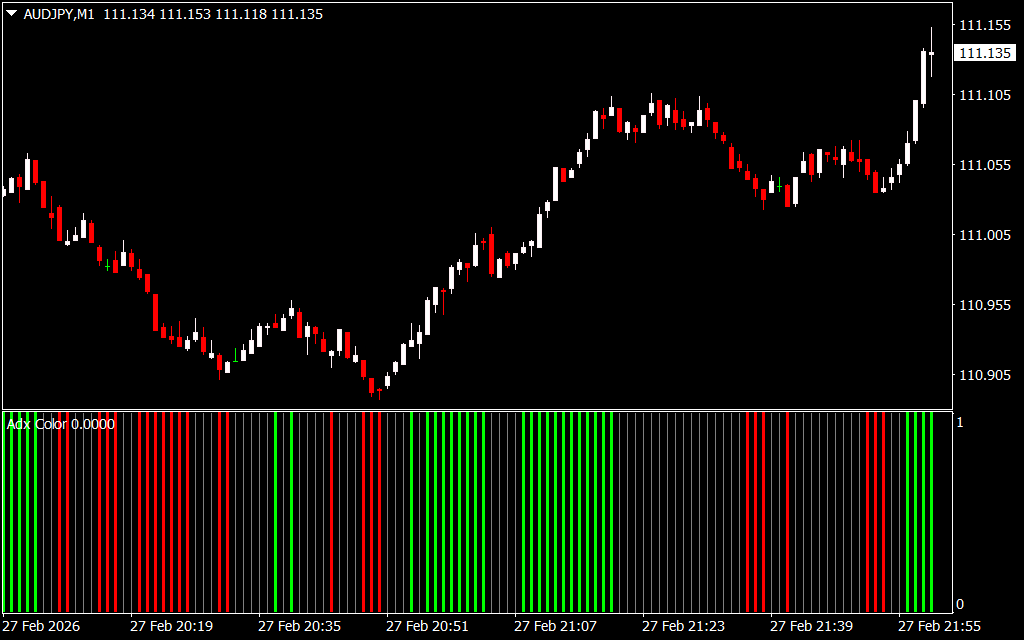
The indicator uses colored histogram bars to show the current trend condition:
- Lime Bars – Bullish trend strength
- Red Bars – Bearish trend strength
- Gray/Black Bars – Weak or non-trending (ranging) market
Instead of analyzing +DI and –DI crossovers separately, traders can instantly identify the dominant trend through the color displayed.
The indicator also allows parameter customization, enabling traders to adjust sensitivity and trend detection settings based on their strategy.
How to Use ADX Color Indicator in Trading
✔ Trend Confirmation
- Use lime bars to confirm bullish setups
- Use red bars to confirm bearish setups
- Avoid trend strategies when gray bars dominate
✔ Trade Entry Filter
- Enter trades only when the histogram confirms a strong trend
- Combine with moving averages, support/resistance, or Price Action
✔ Trade Management
- Stay in trades while the histogram maintains the same trend color
- Consider exiting when the color shifts or turns neutral
Benefits of the ADX Color Indicator
✔ User-Friendly
Simplifies traditional ADX signals into easy-to-read colored bars, ideal for beginners.
✔ Clear Trend Strength Identification
Instantly shows whether the market is trending strongly or ranging.
✔ Excellent Confluence Tool
Works effectively alongside other technical indicators for higher-probability setups.
✔ Customizable Settings
Allows traders to adjust parameters according to their trading style.
Conclusion
The ADX Color Indicator for MT4 transforms the traditional ADX into a visually intuitive and beginner-friendly trend strength tool. By using colored histogram bars, it simplifies market analysis and helps traders confirm entries, manage trades, and avoid ranging conditions. When combined with proper risk management and other technical tools, it can significantly enhance trading decisions.
FAQ
3 Downloads
Published:
Mar 01, 2026 16:41 PM
Category: