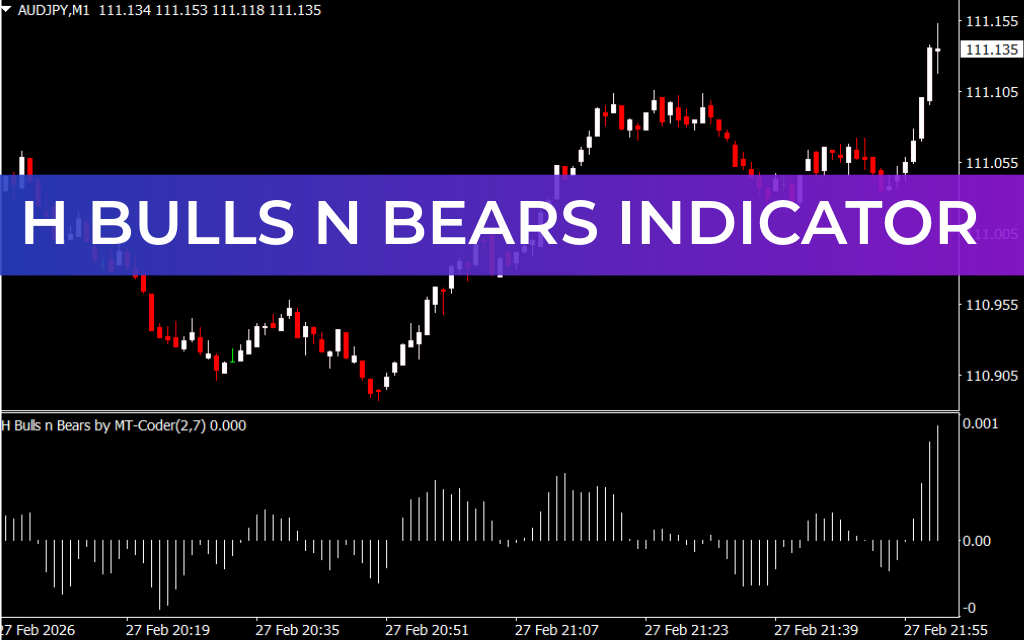
The H Bulls n Bears Indicator for MT4 is a powerful technical tool designed to evaluate the strength of buyers (bulls) and sellers (bears) in the forex market. By analyzing market momentum, it helps traders identify trend direction and potential reversal zones, making it suitable for Scalping, intraday, and swing trading strategies.
How the H Bulls n Bears Indicator Works
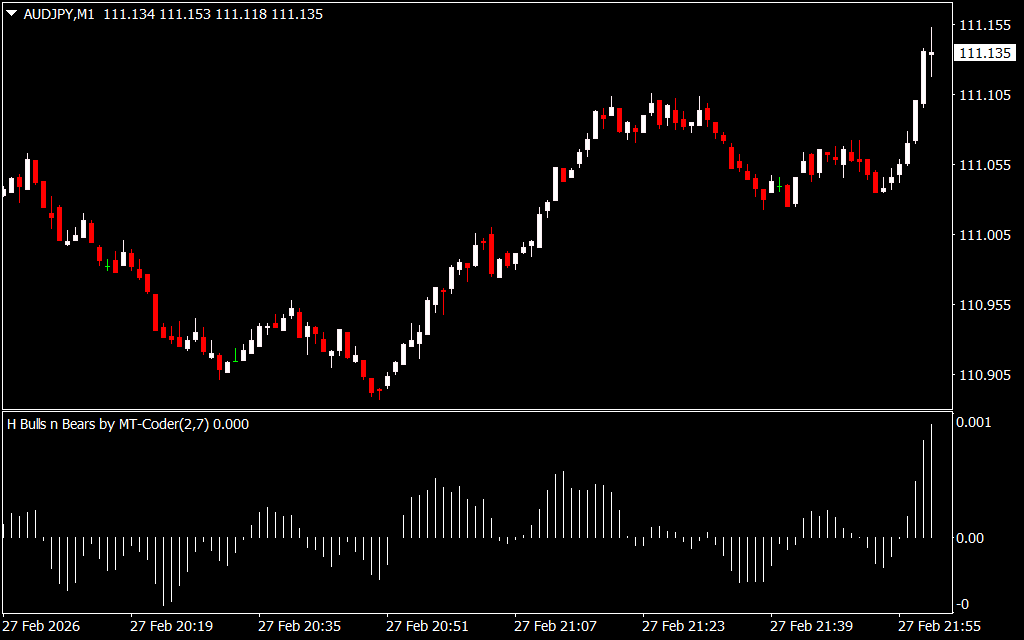
The indicator calculates bull and bear strength based on the difference between the highest/lowest prices and an Exponential Moving Average (EMA). The results are displayed as histogram bars for easy visualization:
- Bars above zero line → Bull power, indicating potential bullish moves
- Bars below zero line → Bear power, indicating potential bearish moves
This visual representation allows traders to quickly gauge market momentum and identify trading opportunities aligned with the trend.
Trading Strategy
While the indicator is simple, it is most effective when combined with overall trend direction:
Buy Setup
- Confirm the market is in an uptrend (higher highs and lows).
- Wait for histogram bars to cross above the zero line, signaling bullish strength.
- Enter a Buy trade at candle close.
- Place stop loss below the recent swing low.
- Exit when the histogram bars weaken or trend reverses.
Sell Setup
- Confirm the market is in a downtrend.
- Wait for histogram bars to cross below the zero line, signaling bearish strength.
- Enter a Sell trade at candle close.
- Place stop loss above the recent swing high.
- Exit when bullish momentum starts to return.
By trading in alignment with the trend, traders can minimize false signals caused by market fluctuations.
Key Features
- Measures bulls’ and bears’ strength in the market
- Histogram bars provide clear visual cues
- Bars above zero → Bullish momentum, below zero → Bearish momentum
- Works on all MT4 timeframes
- Suitable for scalping, intraday, and swing trading
- Helps identify potential trend reversals and continuation zones
- Beginner-friendly and free to download
Why Use the H Bulls n Bears Indicator?
This indicator allows traders to:
- Monitor market momentum in real-time
- Identify high-probability buy and sell setups
- Align trades with the trend to reduce false entries
- Make faster trading decisions using histogram visualization
Conclusion
The H Bulls n Bears Indicator for MT4 is an effective momentum-based tool that identifies the strength of buyers and sellers. By highlighting bullish and bearish power through histogram bars, traders can spot trend direction and potential reversal zones, improving trade timing and accuracy. It is a free, beginner-friendly indicator suitable for all levels of forex traders.
FAQ
1 Download
Published:
Feb 27, 2026 17:51 PM
Category: