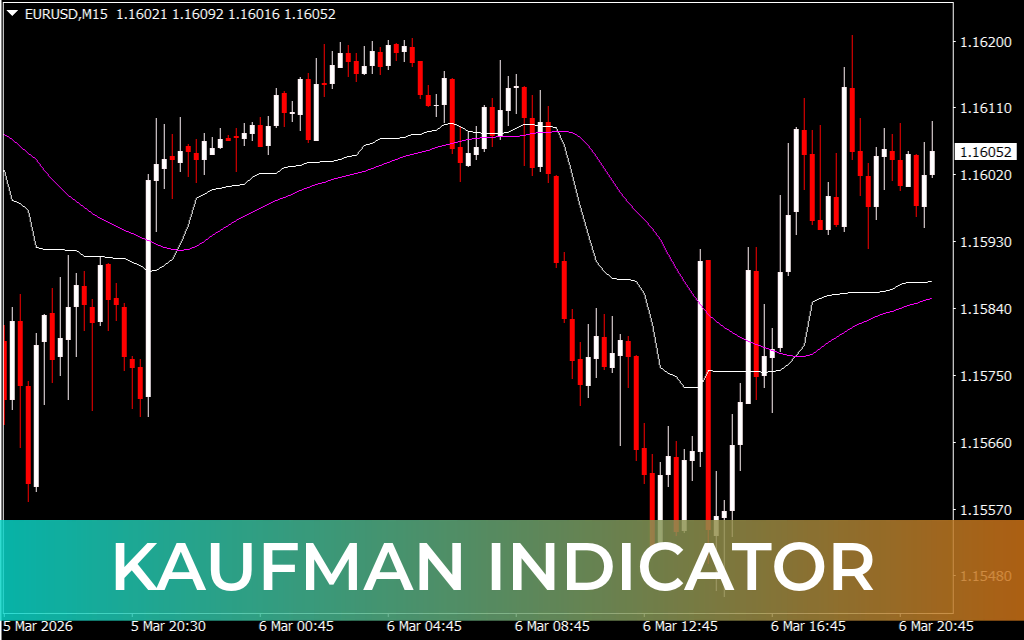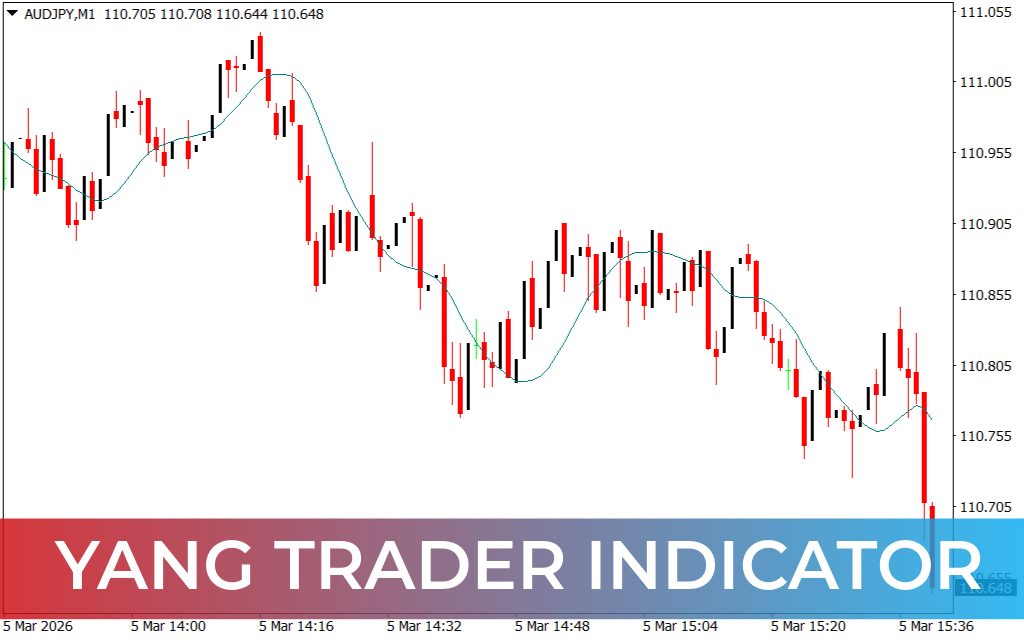
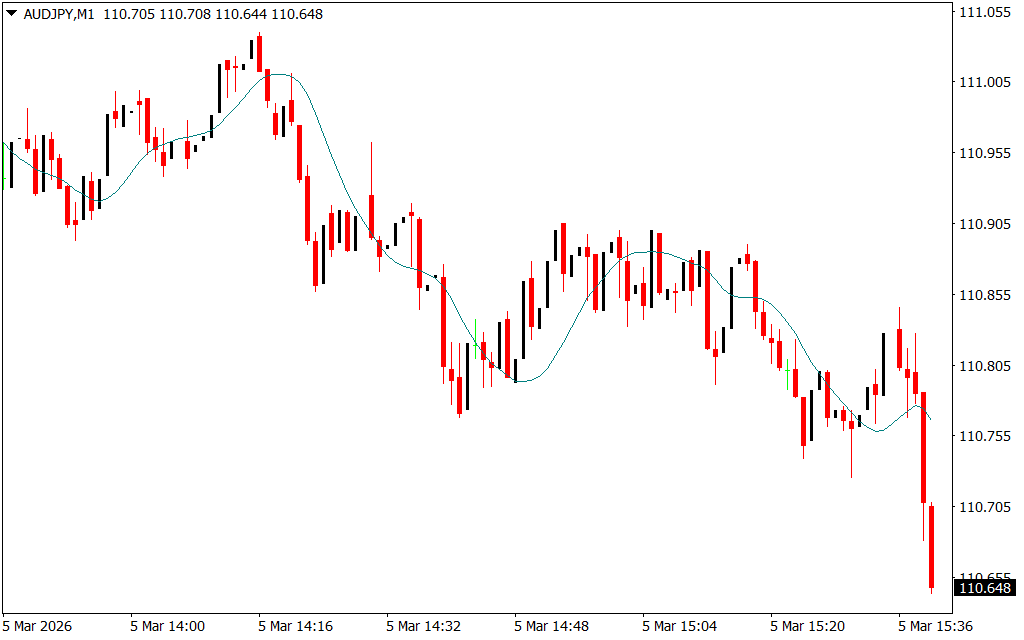
The Yang Trader Indicator for MT4 is a trend-following tool that smooths price movements and helps traders determine market bias across multiple timeframes. It’s designed to assist beginner traders in accurately assessing trends and spotting potential breakout zones in both forex and stock markets.
Key Features of Yang Trader Indicator
- Multi-Timeframe Trend Analysis – Smooths price data to reveal the underlying market trend across different chart intervals.
- 34-Period Moving Average – Acts as the primary trend signal and helps identify potential trend reversals.
- Dynamic Support And Resistance – Moving average levels provide guidance for pullbacks and breakout zones.
- User-Friendly – Suitable for beginner, intermediate, and advanced traders seeking Trend Confirmation.
How to Trade Using Yang Trader
- Bullish Trend: Price above the Yang Trader level signals an uptrend; look for buying opportunities aligned with the trend.
- Bearish Trend: Price below the indicator level signals a downtrend; consider short trades.
- Breakout Trading: For example, on a GBP/USD H4 chart, a price drop below the indicator level coinciding with a triangle support breakout can indicate a high-probability short entry.
- Confirmation: Since the indicator does not provide exact entry points, combine it with Price Action analysis or other technical tools to optimize trade entries.
By following the trend direction indicated by the Yang Trader, traders can filter market noise and identify high-probability setups.
Conclusion
The Yang Trader Indicator for MT4 is a reliable tool for smoothing price movements and determining market trends across multiple timeframes. While it provides trend bias and breakout signals, traders should use additional analysis for precise trade entries. The indicator is beginner-friendly and enhances decision-making in both forex and stock markets.
FAQ
Published:
Mar 05, 2026 09:42 AM
Category: