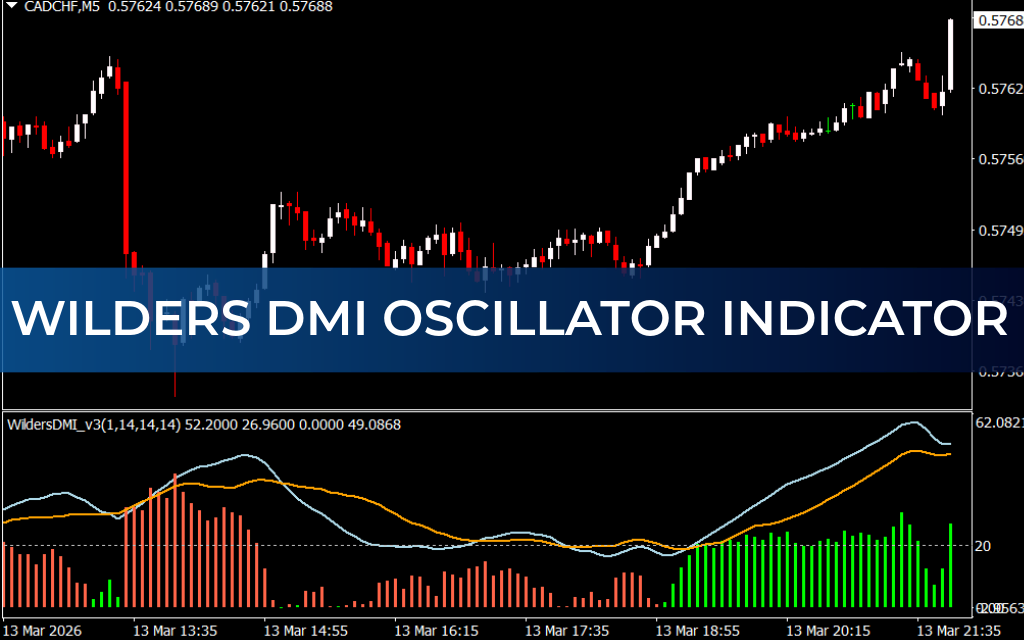
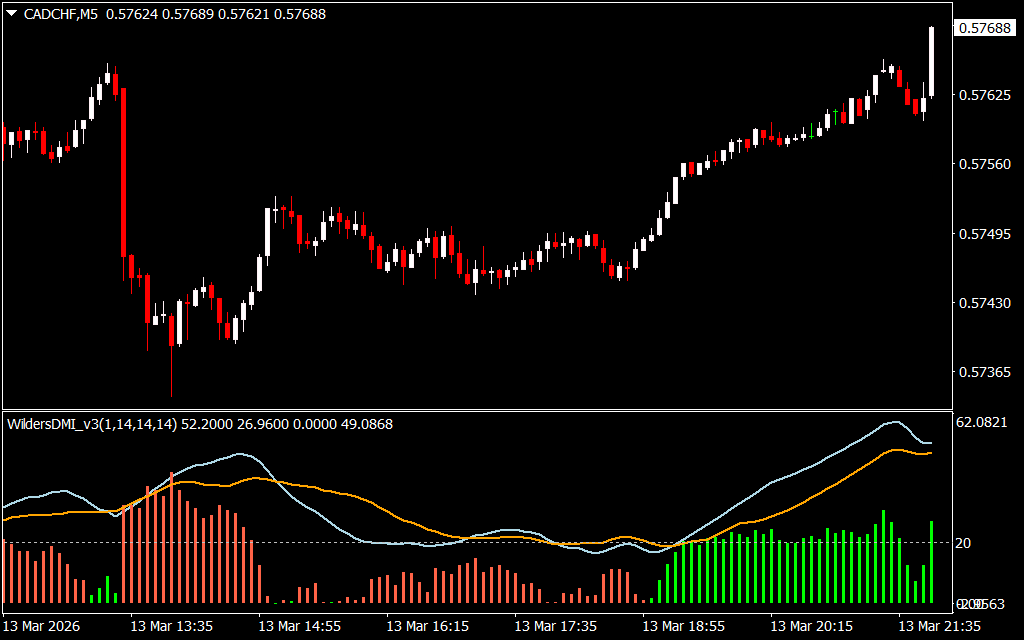
The Wilders DMI Oscillator Indicator is a powerful tool that measures the strength and direction of price trends. By combining directional lines with a histogram, it provides traders with actionable insights into both market momentum and volatility. Ideal for beginners and experienced traders, this oscillator works across all timeframes, making it versatile for short-term or long-term trading strategies.
How the Wilders DMI Oscillator Works
The indicator features:
- Light Blue Line (+DI) – Shows upward price momentum.
- Orange Line (-DI) – Shows downward price momentum.
- Histogram – Indicates the strength of the trend and price volatility.
By analyzing the behavior of these lines and the histogram, traders can identify optimal buy or sell signals and determine when to enter or exit trades.
Buy and Sell Signals
Buy Signal
- Go long when the light blue line (+DI) is above the orange line (-DI).
- Strong buy signals occur when the histogram is above 20 and the bars are lime-colored, confirming an uptrend.
- Consider entering when the crossover occurs or wait for additional price confirmation.
Sell Signal
- Open a short position when the orange line (-DI) is above the light blue line (+DI).
- Strong sell signals occur when the histogram is above 20 and the bars are tomato-colored, confirming a downtrend.
- Exit when the two lines intersect or when the histogram changes color, signaling a Trend Reversal.
Real Market Example
For example, in the GBP/JPY daily chart, the light blue line is above the orange line, and the histogram exceeds 20 with lime-colored bars. This indicates a strong uptrend and an ideal buy opportunity. The trade should be closed when the histogram turns tomato and the orange line crosses above the blue line, signaling a downtrend.
Why Traders Rely on the Wilders DMI Oscillator
- Determines Trend Strength and direction accurately.
- Highlights price volatility for safer trade decisions.
- Works on all timeframes and trading instruments.
- Suitable for both new and experienced traders.
- Provides clear visual signals via line crossovers and histogram levels.
Conclusion
The Wilders DMI Oscillator Indicator is an essential tool for traders who want to trade with confidence. By monitoring the crossover of the lines and histogram levels, traders can identify strong entry and exit points, enhancing their trading strategy and minimizing risk. Open trades when the histogram is above 20 to maximize trend-following potential.
FAQ
1 Download
Published:
Mar 13, 2026 19:11 PM
Category: