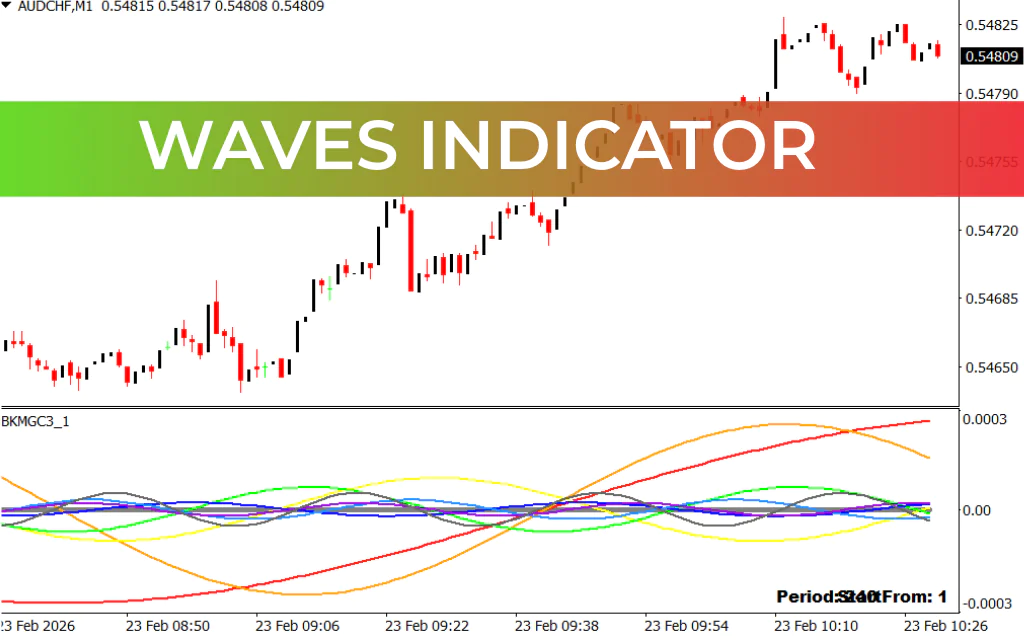
The Waves Indicator is a sophisticated market analysis tool that visualizes price cycles and fluctuations across multiple timeframes. By displaying several dynamic waveforms simultaneously, it allows traders to detect emerging trends, potential reversals, and repeating market rhythms. This multi-dimensional perspective helps traders anticipate turning points with higher accuracy and refine their timing for both short-term and long-term trades.
Unlike standard trend indicators, which track linear price movement, the Waves Indicator emphasizes cyclical price behavior. This makes it especially useful for traders employing Elliott Wave Theory, cycle analysis, or other rhythm-based strategies. It is suitable for trading forex, stocks, or commodities, providing a clearer view of price dynamics than conventional tools.
How the Waves Indicator Works
The indicator generates multiple colored waveforms, each representing different market cycles:
- Wave Alignment – When several waves move in the same direction, it signals a strong trend.
- Upward alignment → bullish trend.
- Downward alignment → bearish trend.
- Wave Convergence – When waves intersect or converge at a specific price level, it suggests a potential reversal zone, useful for entry or exit decisions.
- Diverging Waves – When waves spread apart, it indicates rising volatility and possible trend exhaustion.
- Rhythm & Cycle Analysis – Tracks repeating price cycles, helping traders anticipate market movements based on historical patterns.
By evaluating these wave behaviors, traders can identify high-probability trade setups and confirm broader trends.
Waves Indicator Trading Signals
The indicator provides actionable insights by highlighting key cycle interactions:
- Trend Confirmation – Use wave alignment to identify the dominant market direction.
- Reversal Zones – Look for wave convergence as potential turning points.
- Volatility Warnings – Diverging waves can signal overextended trends or increased market risk.
- Trade Timing – Cycle analysis aids in timing entries and exits based on repeating price patterns.
This combination makes the Waves Indicator versatile for day trading, swing trading, and long-term position trading.
Key Benefits
- Multi-Cycle Analysis – Tracks short- and long-term cycles simultaneously.
- Trend & Reversal Identification – Highlights strong trends and potential pivot points.
- Visual Clarity – Colored waveforms simplify complex cyclical patterns.
- Applicable Across Assets – Works with forex, stocks, and commodities.
- Supports Cycle-Based Strategies – Ideal for Elliott Wave Theory or market rhythm trading.
Conclusion
The Waves Indicator provides traders with a powerful cyclical view of the market, enabling more precise entries, exits, and trend confirmations. By monitoring wave alignment, convergence, and divergence, traders gain insights into both short-term fluctuations and long-term price behavior.
Whether you are a swing trader aiming for optimal timing, a day trader seeking quick reversals, or a long-term investor analyzing macro cycles, the Waves Indicator enhances your ability to anticipate market movements and act with confidence.
FAQ
Published:
Feb 23, 2026 04:33 AM
Category: