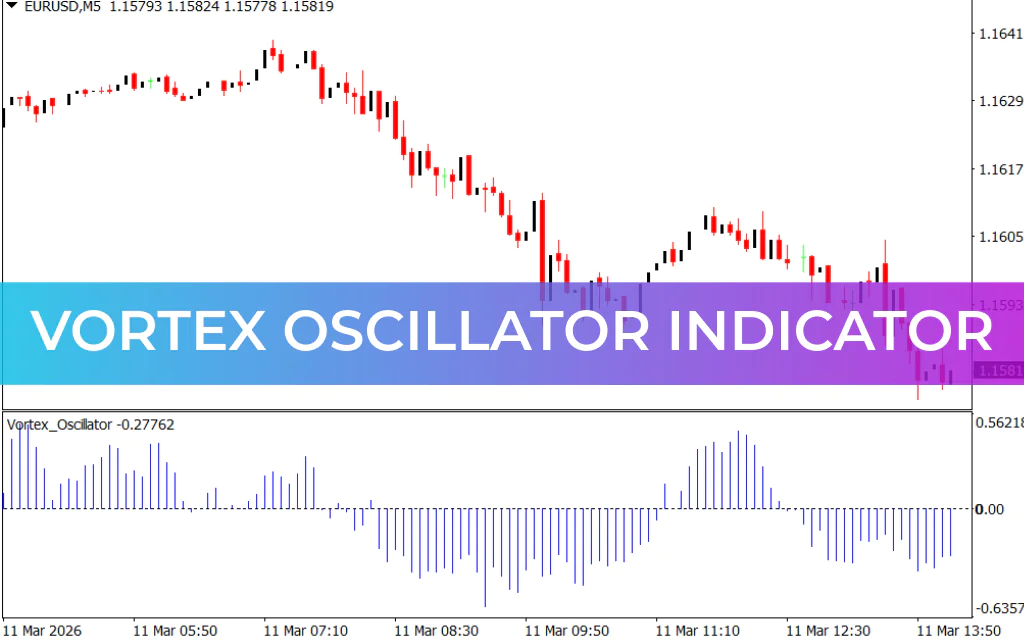
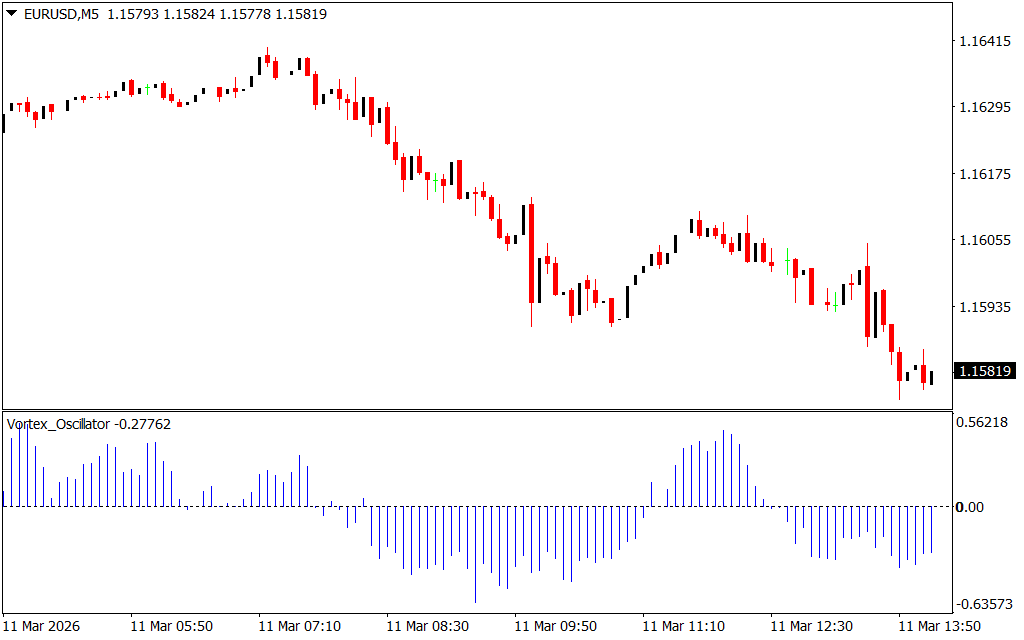
The Vortex Oscillator Indicator for MetaTrader 4 (MT4) is a powerful custom trading tool designed to identify trend reversals and the potential direction of the market. It uses blue histogram bars to display shifts in price momentum and help traders recognize whether the market is turning bullish or bearish.
This indicator is especially useful for traders who want a clear and visual method of identifying trend bias without cluttering their charts with complex tools.
What Is the Vortex Oscillator Indicator?
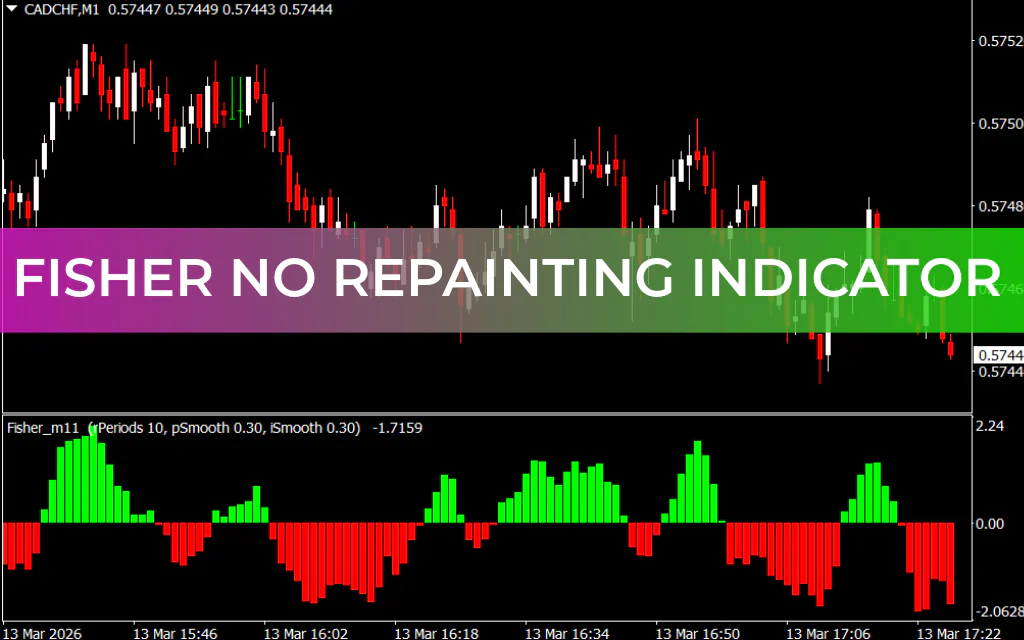
The Vortex Oscillator Indicator analyzes price momentum and plots histogram bars around a 0.00 center line. These bars help traders quickly determine whether buyers or sellers currently dominate the market.
Key features of the indicator include:
- Histogram bars above the 0.00 level – Indicate bullish momentum
- Histogram bars below the 0.00 level – Indicate bearish momentum
- Crosses of the center line – Suggest potential trend reversals
When new bars continue forming above or below the center line, it indicates trend continuation and strong market momentum.
Suitable Trading Styles
The Vortex Oscillator Indicator is flexible and can be used across different trading strategies, including:
- Scalping on lower timeframes
- Day and intraday trading
- Swing trading on higher timeframes
Because of its simplicity and clear signals, the indicator is suitable for beginner, intermediate, and advanced Forex traders.
How to Trade With the Vortex Oscillator Indicator
The indicator helps traders identify optimal entry points by monitoring when the histogram bars cross the center line.
Although it can be used alone, combining it with Price Action or other technical indicators can improve signal accuracy.
Buy Signal
A buy opportunity occurs when:
- A histogram bar crosses above the 0.00 center line
- Price action confirms the move with a bullish candlestick pattern, such as a bullish engulfing candle
Trading approach:
- Enter a BUY or long position
- Follow the trend while histogram bars remain above the center line
Sell Signal
A sell opportunity occurs when:
- A histogram bar crosses below the 0.00 center line
- Price action confirms the move with a bearish candlestick pattern
Trading approach:
- Enter a SELL or short position
- Stay in the trade while bars remain below the center line
Improving Trading Accuracy
For stronger signals, traders often combine the Vortex Oscillator with other technical tools such as:
- Support And Resistance levels
- Moving averages
- RSI (Relative Strength Index)
- Price action patterns
Using multiple indicators can help confirm market direction and reduce false signals.
Conclusion
The Vortex Oscillator Indicator for MT4 is a simple yet effective tool for identifying trend reversals and market momentum. With clear histogram signals and a centerline crossover system, traders can quickly determine whether the market is bullish or bearish.
Its easy-to-read design makes it suitable for traders of all experience levels. You can download the Vortex Oscillator Indicator for MT4 for free and start using it to improve your trading strategy today.
FAQ
Published:
Mar 11, 2026 09:14 AM
Category: