The Vortex Indicator for MT4 is a versatile trend-following tool that provides forex traders with trend direction, Trend Strength, and BUY/SELL signals. Featuring two oscillating lines, the indicator helps identify the start of a new trend and optimal reversal points, making it valuable for intraday, swing, and long-term traders.
How the Vortex Indicator Works
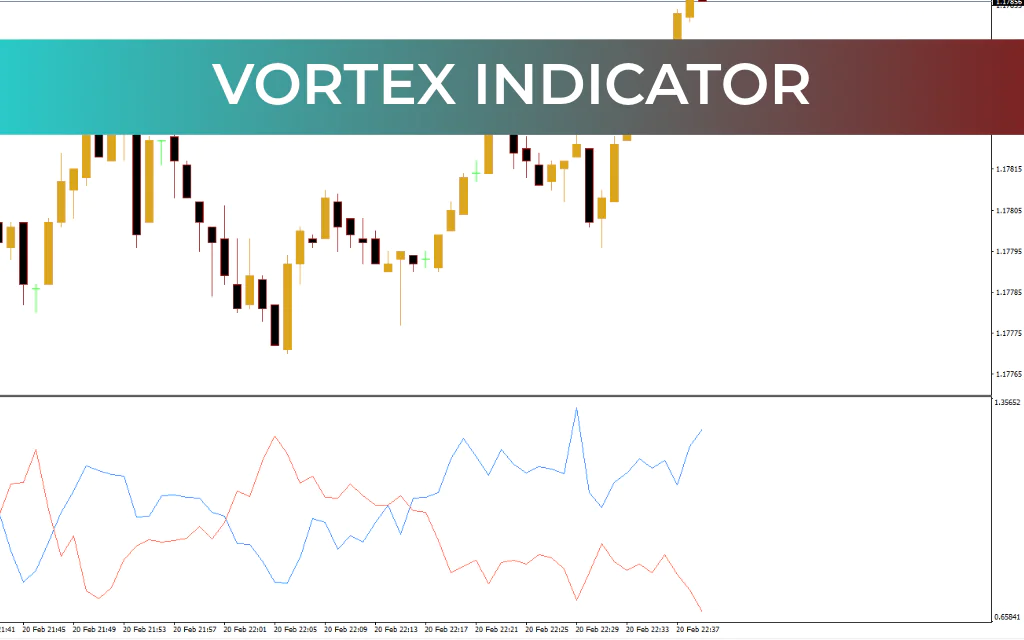
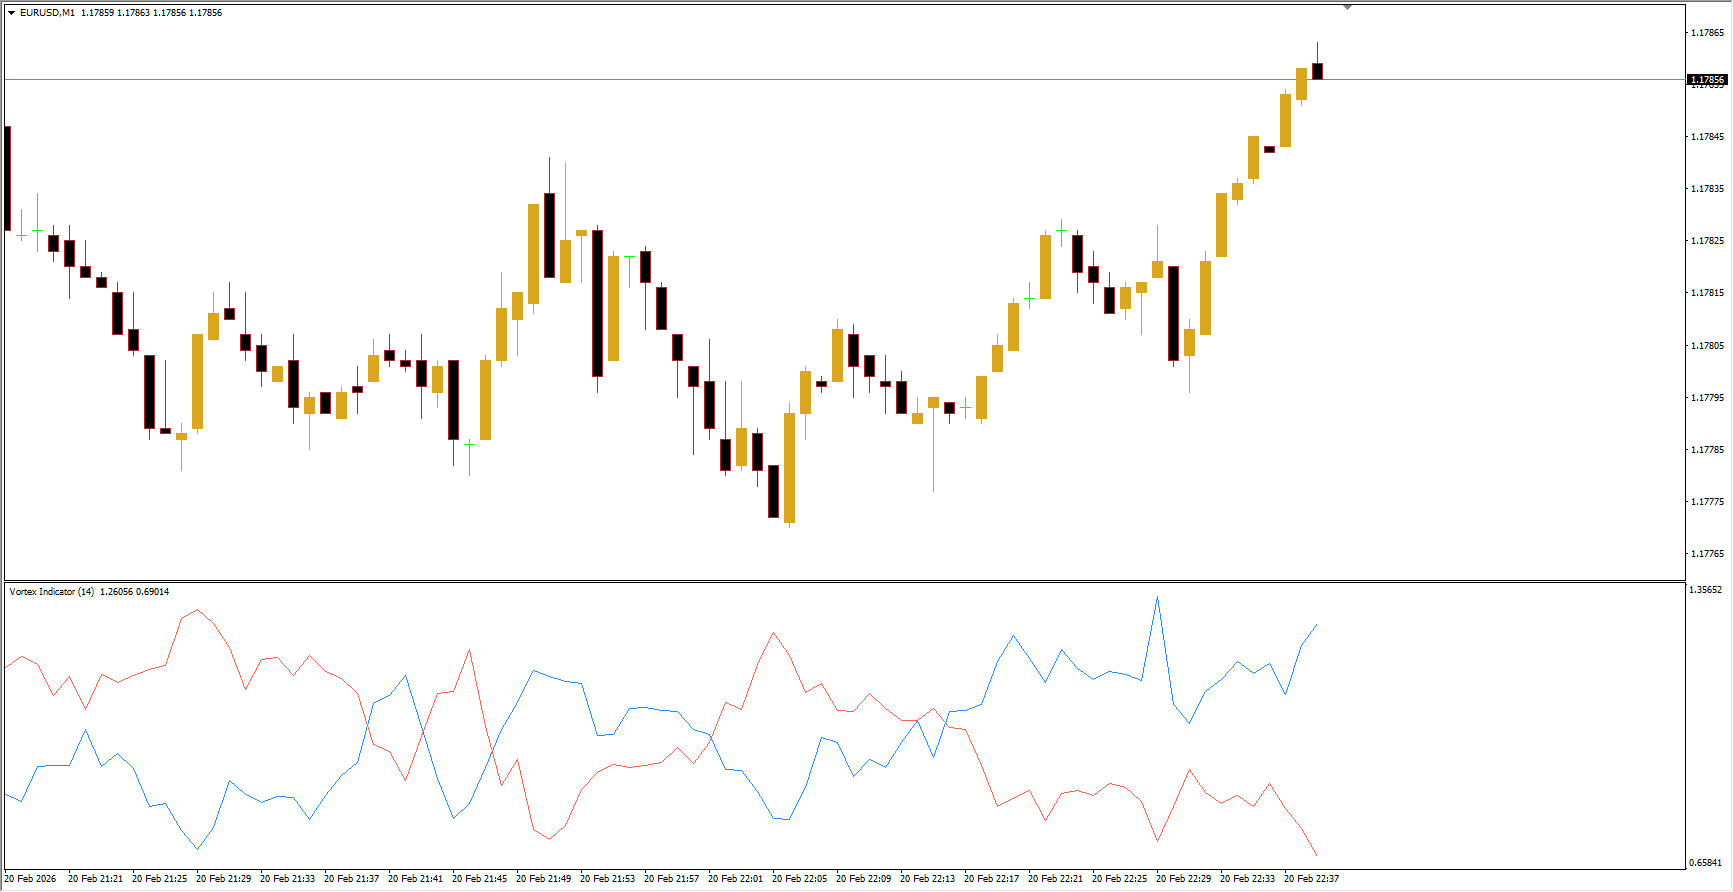
The indicator consists of two lines:
V+ Line (Uptrend) – Displayed in Dodger Blue, indicates bullish trends.
V- Line (Downtrend) – Displayed in Tomato Red, indicates bearish trends.
Traders can apply the Vortex indicator to any timeframe and any trading instrument. It is available for free download for MT4.
Trading Signals with Vortex
The primary signals are based on line crossovers:
Buy Signal: When the V+ (Dodger Blue) line crosses above V- (Tomato Red).
Sell Signal: When the V- line crosses above V+ line.
Traders can hold positions until an opposite crossover occurs.
Trend Analysis with Vortex
The indicator also provides clear visual clues for trend direction and strength:
Trend Direction: The line on top shows the current trend — Dodger Blue on top signals a buy trend, Tomato Red on top signals a sell trend.
Trend Strength: The distance between the lines indicates trend strength. A wide separation suggests a strong trend, while a narrow separation signals a weak trend.
This allows both beginner and advanced traders to quickly assess market conditions. Advanced traders can adjust settings to filter weaker signals or optimize performance for specific currency pairs and timeframes.
Conclusion
The Vortex MT4 Indicator is an effective tool for both intraday and long-term trend trading. By providing trend direction, trend strength, and reliable crossover signals, it helps traders follow market trends with confidence. The indicator is simple to read, customizable, and free to download for MT4, making it a valuable addition to any forex trading strategy.
FAQ
Published:
Feb 20, 2026 15:42 PM
Category: