Measuring market volatility is crucial for successful forex trading, and the Volatility Quality Indicator for Metatrader 4 provides traders with both volatility and Trend Strength in a single indicator window. It features customizable arrow signals, trading alerts, and multi-timeframe capabilities to help traders make informed decisions.
How to Trade Using Volatility Quality Indicator Signals
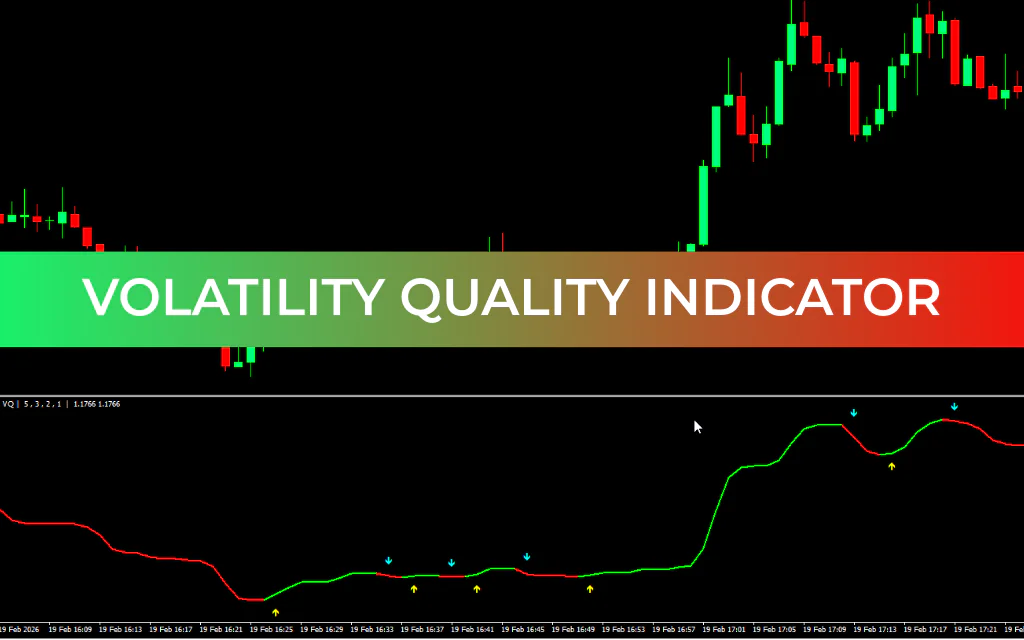
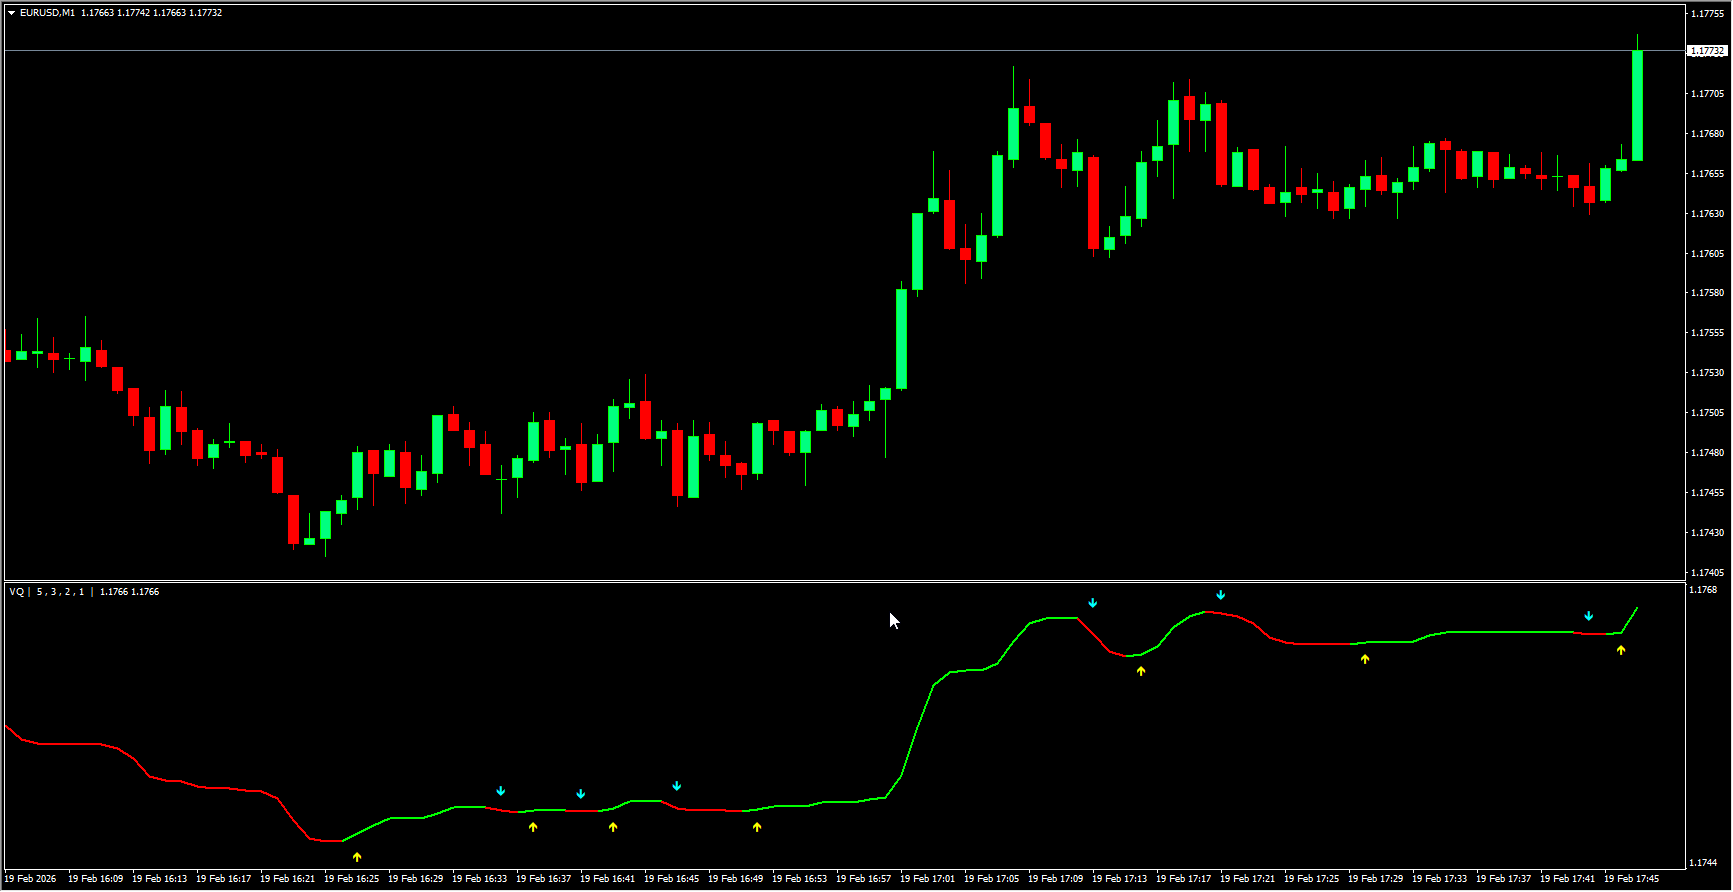
On the USDJPY H4 chart example, BUY signals are displayed in LIME, while SELL signals appear in RED, marked with arrows. The indicator line remains LIME during upward trends and RED during downward trends, helping traders visually track trend direction.
This MT4 indicator is versatile and suitable for all types of forex trading, including breakout strategies. Technical traders can customize it to receive signals from higher timeframes, making it ideal for a multi-timeframe trading approach. By opening multiple indicator windows across different timeframes, traders gain a TOP-DOWN perspective on market volatility, enhancing trading accuracy.
Unlike many volatility indicators displayed as meters, this tool is presented as a line indicator with arrow signals and alerts, making it intuitive for beginners while still providing advanced functionality for experienced traders. It allows traders to identify various volatility levels and plan trades effectively.
Custom Settings
The Volatility Quality MT4 indicator is highly flexible. While the best settings may vary depending on the currency pair, the indicator can be customized to match different trading strategies and timeframes, providing optimal signals for any forex pair.
Conclusion
The Volatility Quality Indicator for MT4 analyzes historical price data to measure market volatility. Recognized as a leading Volatility Indicator, it provides accurate trading signals and supports comprehensive chart-based technical analysis. Forex traders who rely on volatility for trading strategies will find this indicator indispensable.
FAQ
2 Downloads
Last Update:
Feb 19, 2026 14:04 PM
Published:
Feb 19, 2026 10:52 AM
Category: