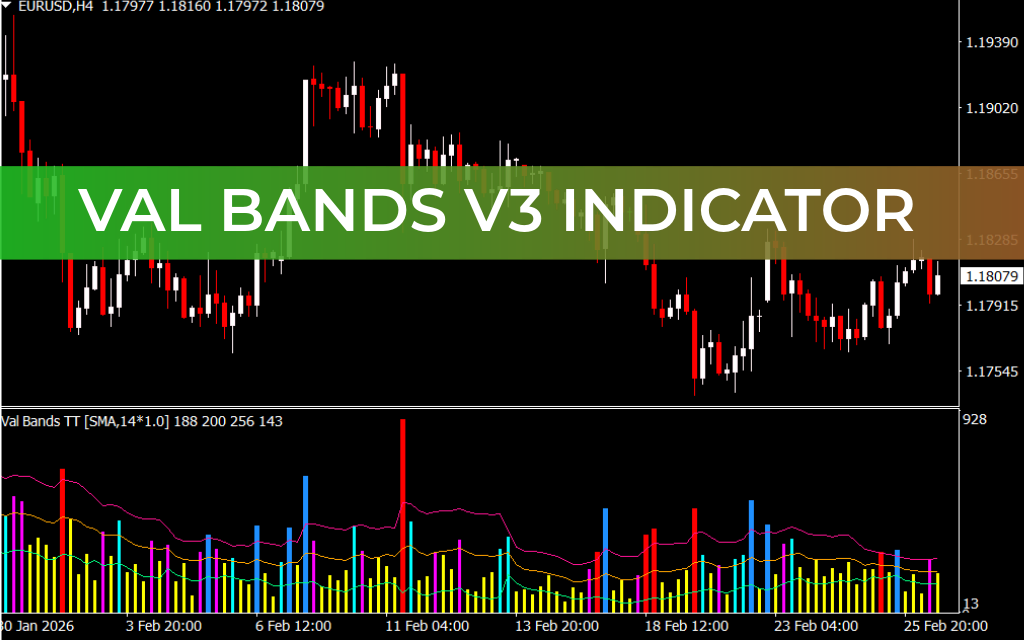
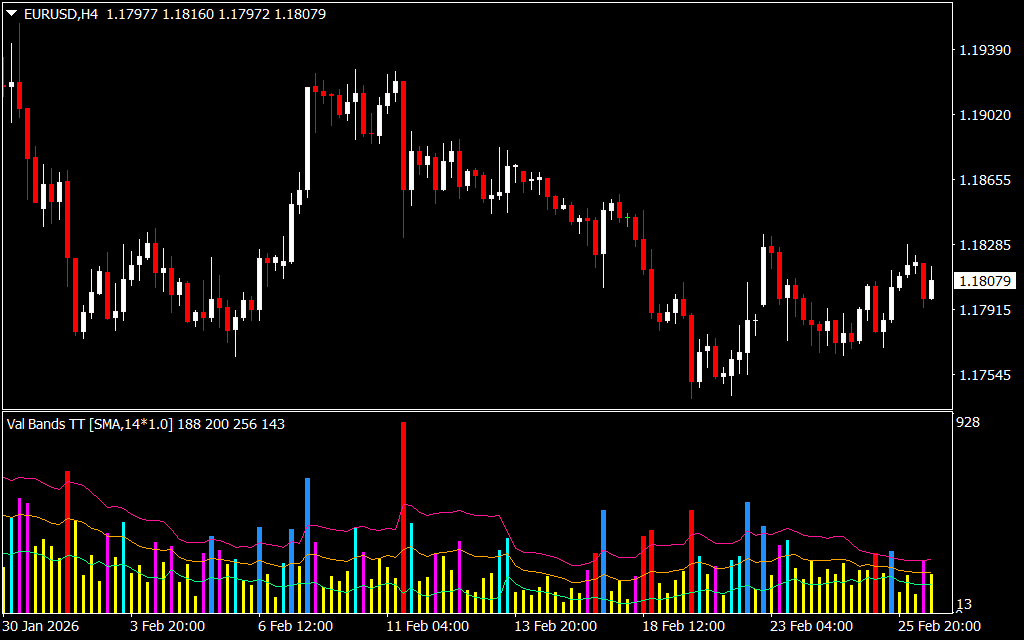
The Val Bands V3 Indicator for MT4 is a powerful technical analysis tool that measures candlestick lengths and plots a Bollinger Band based on candle size. Designed for the MetaTrader 4, this indicator helps traders identify flat markets, as well as the early stages of bullish or bearish trends.
Its visually intuitive colored histogram makes it suitable for both beginner and advanced traders, and it can be applied to all chart timeframes.
How the Val Bands V3 Indicator Works
The indicator plots:
- Histogram Bars – Representing candlestick lengths
- Yellow Bars – Flat or neutral market
- Blue Bars – Beginning of a bullish trend
- Red Bars – Beginning of a bearish trend
- Bollinger Bands – Calculated using candlestick lengths, providing dynamic trend thresholds
Key Insights:
- Histogram bars below the lower Bollinger band indicate a neutral trend
- Movement from the lower to the upper Bollinger band, accompanied by red or blue bars, signals the start of a trend
This setup allows traders to visualize market momentum and anticipate trend reversals effectively.
Val Bands V3 Trading Strategy
Bullish Setup
- Signal: First blue histogram bar appears above the lower Bollinger band
- Entry: Open a buy trade
- Stop Loss: Below the previous swing low
- Take Profit: Exit at the appearance of a red histogram bar or opposite signal
Bearish Setup
- Signal: First red histogram bar appears above the lower Bollinger band
- Entry: Open a sell trade
- Stop Loss: Above the previous swing high
- Take Profit: Exit at the appearance of a blue histogram bar or opposite signal
By focusing on the first colored histogram bar in the direction of the trend, traders can enter early and maximize potential profit.
Key Features and Benefits
1. Trend Detection via Candlestick Length
Identifies the beginning of bullish or bearish moves using candle size analysis.
2. Flat Market Identification
Yellow histogram bars help avoid trading during low-volatility periods.
3. Multi-Timeframe Compatibility
Works on all intraday and higher chart timeframes.
4. Easy Visual Interpretation
Multi-colored histogram and Bollinger bands simplify trend spotting.
5. Suitable for All Traders
Beginner-friendly while providing advanced analysis for experienced traders.
Why Use the Val Bands V3 Indicator for MT4?
Candlestick length is a key measure of momentum, yet most indicators focus only on price levels. Val Bands V3 uses candle size combined with Bollinger Bands to provide early signals for trend changes. This makes it an essential tool for traders looking to enter trends early while avoiding flat market noise.
Conclusion
The Val Bands V3 Indicator for MT4 is a versatile tool for Forex traders that combines candlestick length analysis with Bollinger Bands. By providing clear histogram signals for bullish, bearish, and neutral markets, it helps traders time entries and exits more effectively. Download the Val Bands V3 Indicator today to enhance your candlestick-based trading strategy.
FAQ
4 Downloads
Published:
Feb 26, 2026 09:32 AM
Category: