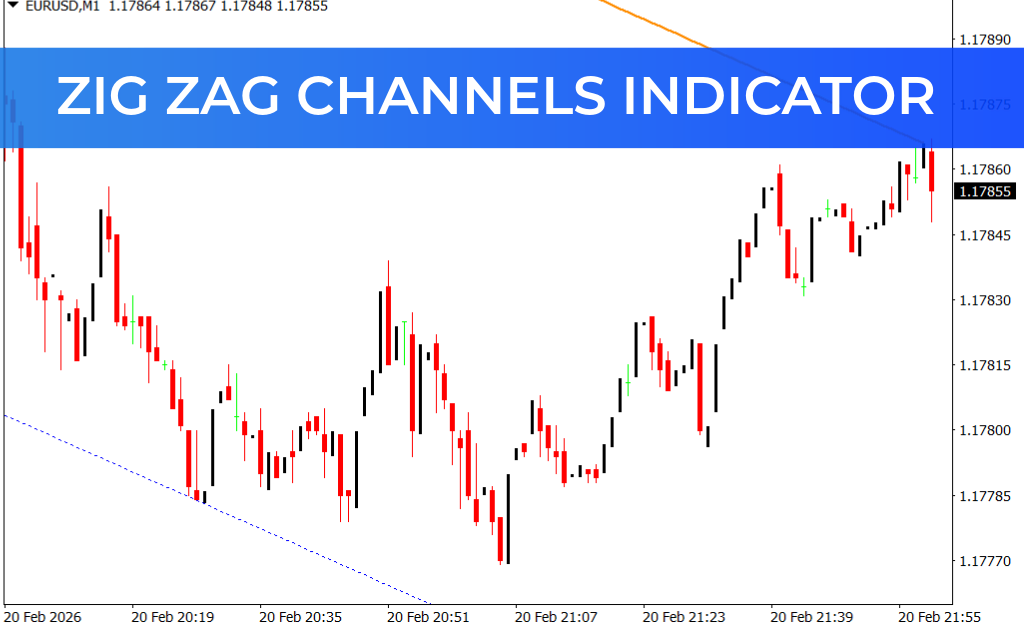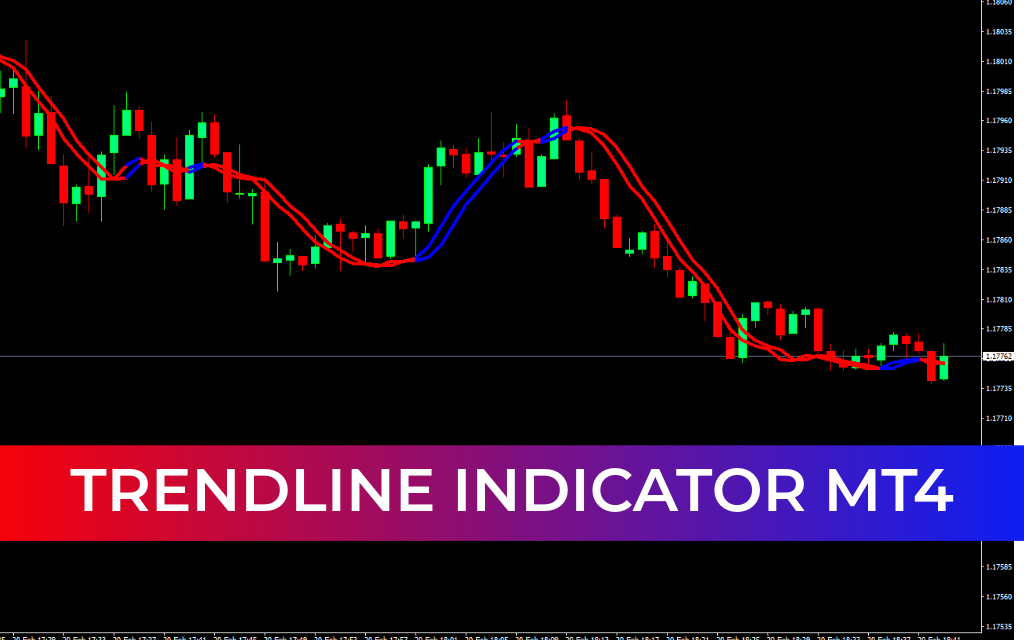
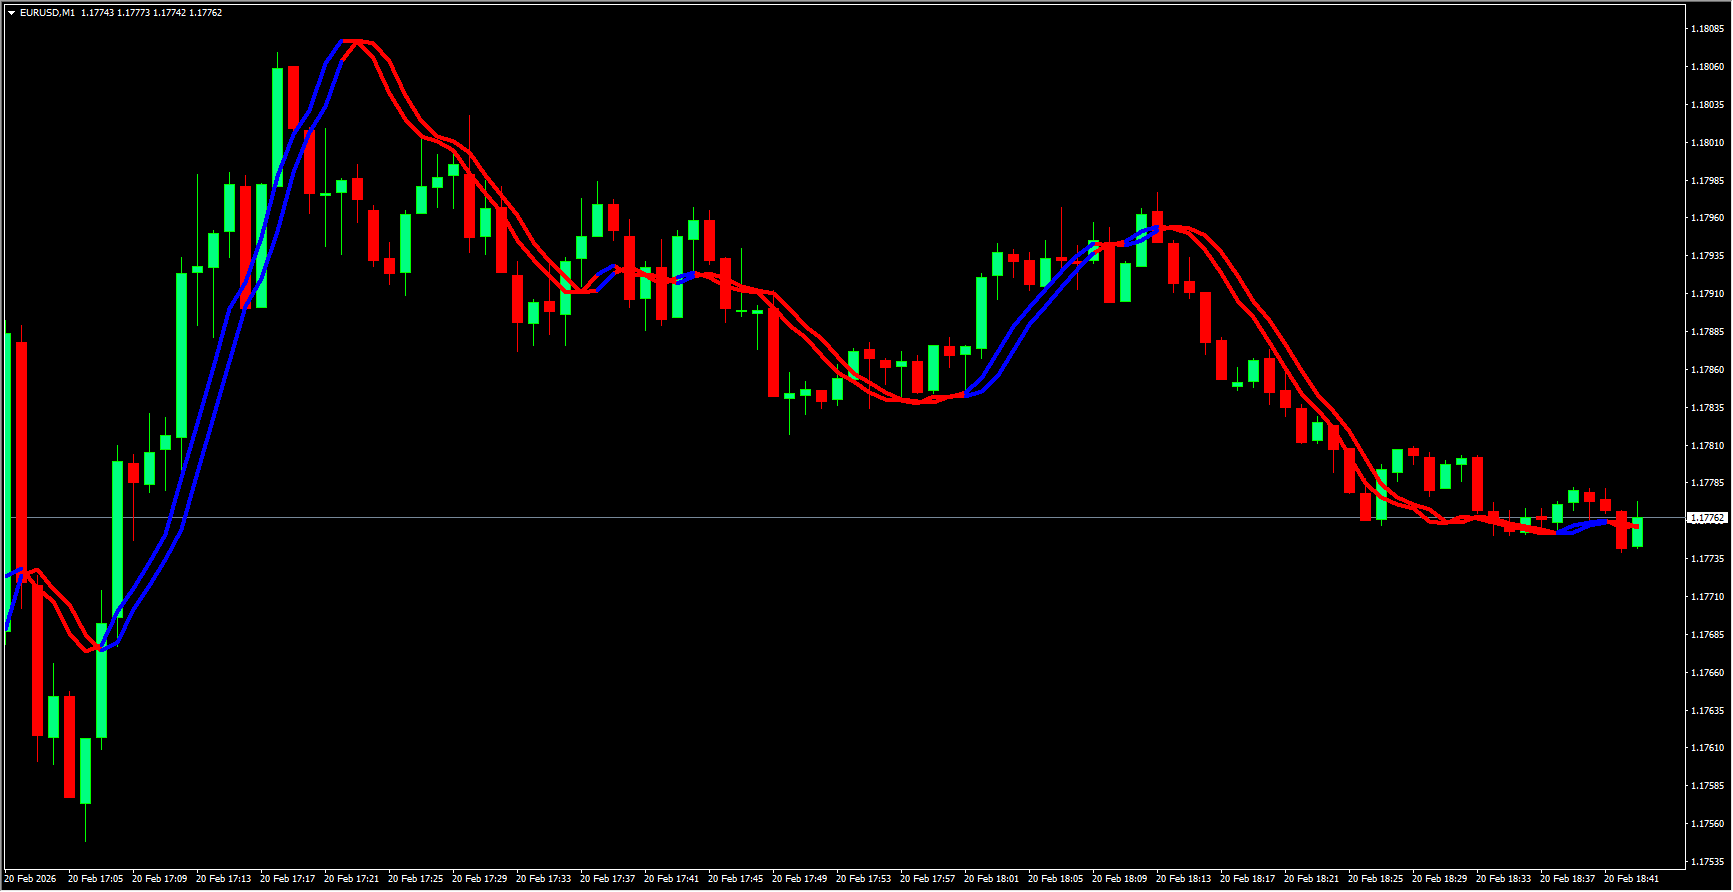
The Trendline Indicator for MT4 is an automatic trend line tool that identifies dynamic market trends using the Least Square Moving Average (LSMA), rather than drawing static straight lines. It is designed to help traders determine the correct market trend, identify real-time dynamic Support And Resistance, and pinpoint potential entry levels aligned with the prevailing trend.
Beyond trend detection, this indicator also aids in filtering Price Action signals to assess the probability of successful trade setups. For instance, a bullish pin bar or breakout aligned with the current trend has a higher chance of profitability than trading against the trend. The Trendline indicator can also enhance Expert Advisor (EA) performance, providing precise conditions for automated entries based on support/resistance at the trendline.
This non-repaint, MA-based indicator works not only for forex instruments but also for stocks, futures, and cryptocurrencies. It does not generate fractal-based trend lines.
How the Trendline Indicator Works
The Trendline indicator plots two dynamic lines, which change color based on market trend:
Blue line: Bullish trend
Red line: Bearish trend
To trade with the indicator:
Identify the current trend using the Trendline color.
Wait for price action signals near the trendline that align with the current trend (e.g., breakouts, pin bars, false breaks, or triangle patterns).
Optionally, set MT4 alerts near the trendline to be notified when the price approaches dynamic support or resistance.
Example Strategy:
If the price breaks trendline support and the line turns red, confirming a bearish trend, a sell entry may be ideal.
A bullish price signal near a blue trendline confirms a buy entry, while going against the trend is discouraged.
Key Trading Rules:
The price action signal must occur near the trendline.
The price action signal must align with the trend direction.
Conclusion
The Trendline indicator is an effective MT4 tool for trend analysis and dynamic support/resistance detection. It works best on forex currency charts but is equally suitable for stocks, futures, and other tradable assets. By combining trend detection with price action confirmation, traders can identify higher-probability trade setups and enhance both manual and automated trading strategies.
FAQ
3 Downloads
Published:
Feb 20, 2026 11:45 AM
Category: