Free
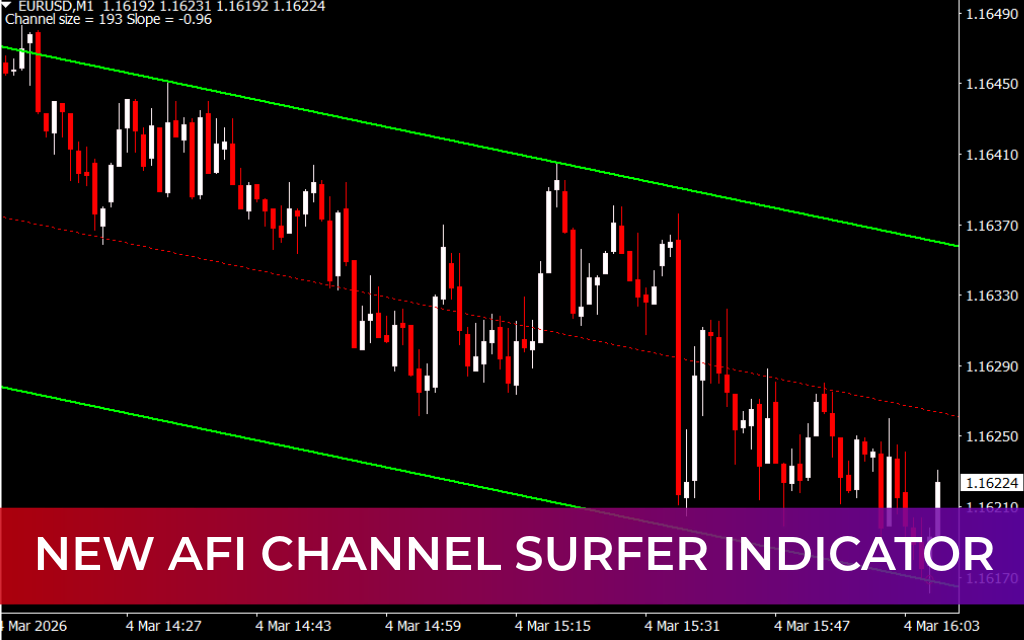
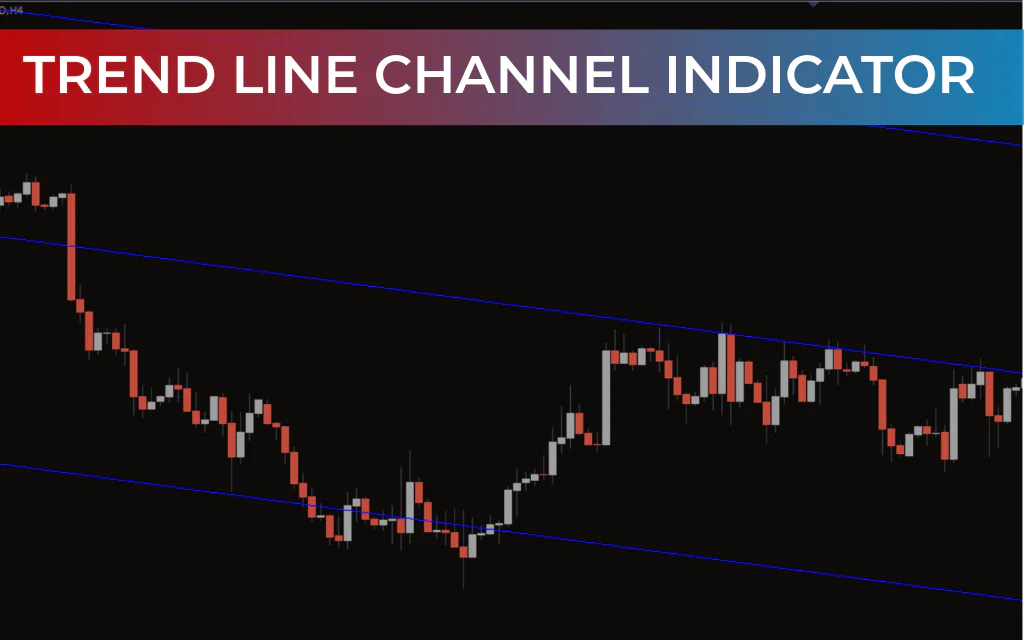
he Trend Line Channel Indicator is a simple yet effective MT4 tool that helps traders visualize the overall market trend. By plotting three lines on the chart, it creates a trend channel that guides long-term trading decisions.
Key Features
- Trend Channel Visualization
- Plots three lines on the chart forming a channel.
- Illustrates bullish, bearish, or sideways trends.
- Helps traders see the general price direction over time.
- Timeframe Focus
- Works best on timeframes higher than 1H.
- Ideal for long-term trading strategies such as swing or position trading.
- Entry and Exit Guidance
- Does not directly provide BUY/SELL signals.
- Traders can combine it with indicators like RSI, MACD, or Stochastics to identify entry and exit points.
- Helps determine support/resistance zones within the channel.
- Market Analysis Enhancement
- Useful for spotting trend continuation and potential trend reversals.
- Provides context for Price Action and overall market direction.
How to Trade Using the Trend Line Channel Indicator
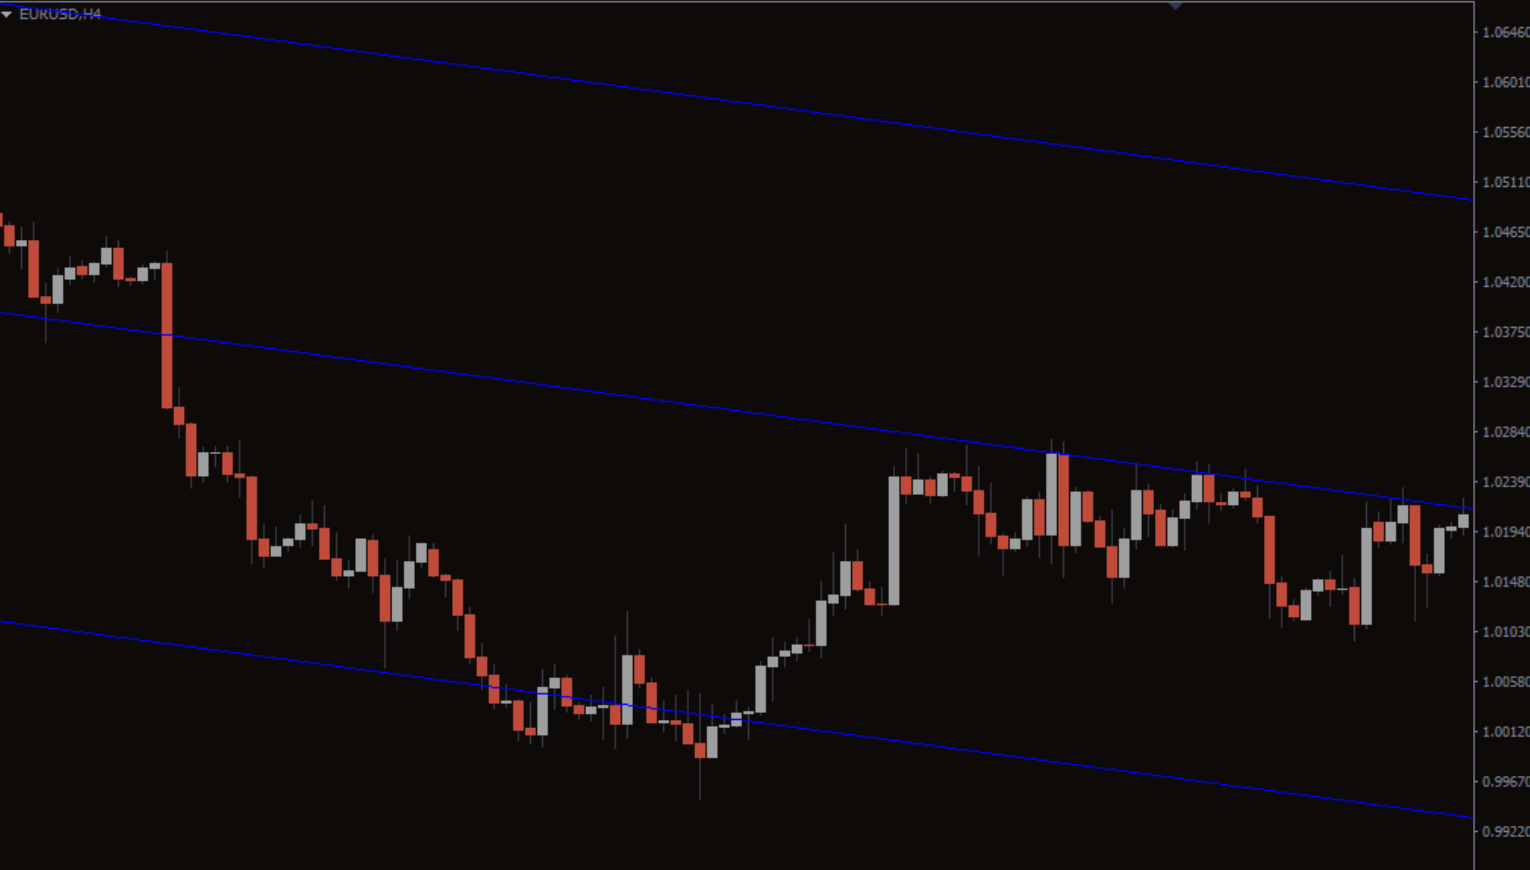
- Identify the Trend
- Price staying near the upper channel → bullish trend.
- Price near the lower channel → bearish trend.
- Price moving sideways → trend consolidation or indecision.
- Combine With Other Indicators
- Use RSI or MACD to confirm momentum and generate entry/exit signals.
- Wait for price interaction with the channel lines before making a trade decision.
- Plan Stop Loss and Take Profit
- Place stop-loss just outside the channel boundaries.
- Set take-profit near opposite channel lines or key price levels.
Best Practices
- Use on H1 and higher timeframes for reliable trend analysis.
- Avoid relying solely on the channel; confirm with other technical indicators or price action.
- Ideal for long-term trend strategies rather than Scalping.
Conclusion
The Trend Line Channel Indicator for MT4 helps traders identify the overall trend direction by creating a visual channel. While it does not give direct BUY/SELL signals, combining it with other indicators can enhance trade accuracy and timing. It is free to download and integrates well with long-term trading strategies.
FAQ
Three lines on chart forming a channel. Illustrates bullish, bearish, or sideways trends. Helps see general price direction over time.
No. Does not directly provide signals. Combine with RSI, MACD, or Stochastics for entry and exit points. Helps determine S/R zones within channel.
Works best on timeframes higher than 1H. Ideal for long-term strategies: swing or position trading.
Price near upper channel = bullish. Price near lower channel = bearish. Price moving sideways = consolidation or indecision.
Traders visualizing overall market trend. Simple yet effective MT4 tool.
5 Downloads
Published:
Mar 06, 2026 17:23 PM
Category:
Share: