Free
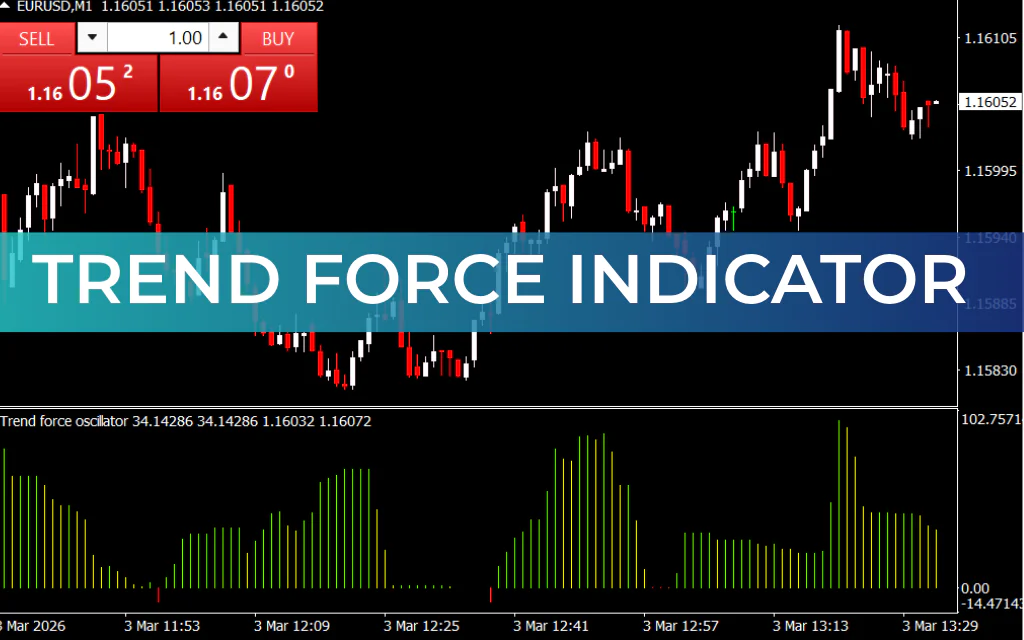
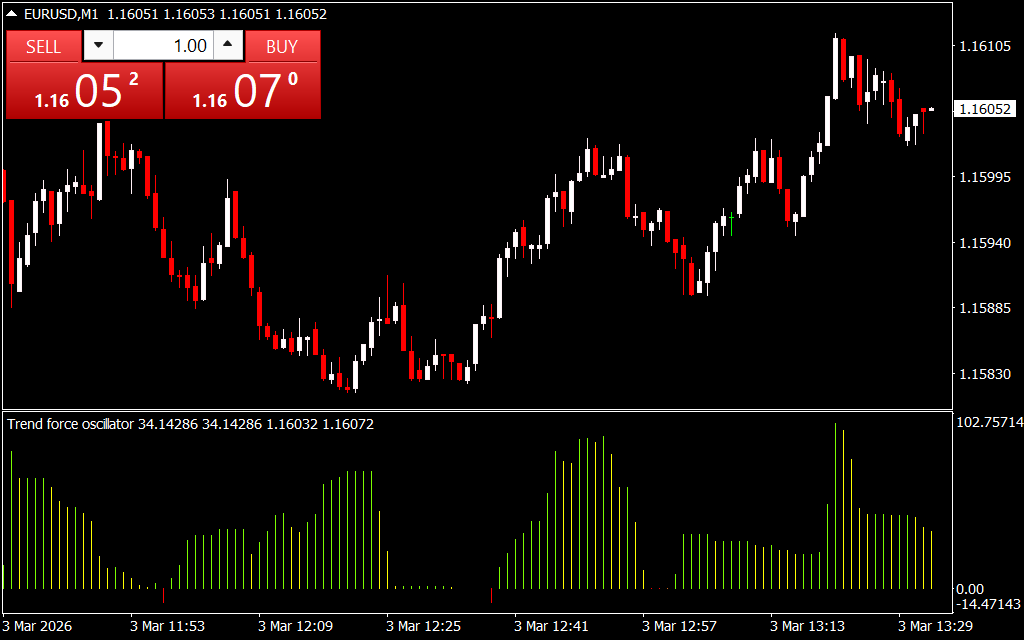
The Trend Force Indicator is a powerful MT4 tool designed to measure Trend Strength using a histogram that oscillates around the zero line, similar to MACD. The histogram’s color changes make it easy for traders to identify whether a trend is strong enough to enter or hold a position.
How the Trend Force Indicator Works
The indicator is based on the Average True Range (ATR) and provides clear visual cues:
- Long Entry: When the histogram rises above the zero line.
- Short Entry: When the histogram drops below the zero line.
- Trend Strength: Color changes indicate momentum—green for bullish, red for bearish, and yellow/chocolate for weakening trends.
Using the Trend Force Indicator on MT4
- Entry Confirmation:
- Do not enter trades solely based on the zero line.
- For long trades, wait for a bullish candle close above zero.
- For short trades, wait for a bearish candle close below zero.
- Exit Strategy:
- Exit when histogram bars start declining and the color changes to yellow (long) or chocolate (short).
- Timeframe Recommendation:
- Best used on 4-hour charts and higher to reduce false signals.
Tips for Optimal Trading
- Combine with trend confirmation or Price Action tools to avoid false entries.
- Perform backtesting to understand the indicator’s behavior under different market conditions.
- Ideal for traders looking to measure trend strength rather than precise entry points.
Conclusion
The Trend Force Indicator for MT4 is a reliable tool for analyzing trend strength using ATR-based histograms. While it works best on higher timeframes, combining it with other indicators improves trade accuracy and helps manage potential false signals.
FAQ
Histogram oscillates around zero line (similar to MACD). Based on ATR. Long entry: histogram rises above zero. Short entry: histogram drops below zero. Color changes: green = bullish, red = bearish, yellow/chocolate = weakening.
Do not enter solely on zero line. For longs: wait for bullish candle close above zero. For shorts: wait for bearish candle close below zero.
Exit when histogram bars start declining and color changes to yellow (long) or chocolate (short). Indicates weakening trend.
Traders measuring trend strength. Those wanting ATR-based signals. MT4.
Whether trend is strong enough to enter or hold. Momentum. Weakening trends.
1 Download
Published:
Mar 03, 2026 07:34 AM
Category:
Share: